

11/20/2020 11:00 AM
Not much movement other than some chop for today. As to be expected with OPEX. Let’s look at a couple charts and indicators to see where we stand.
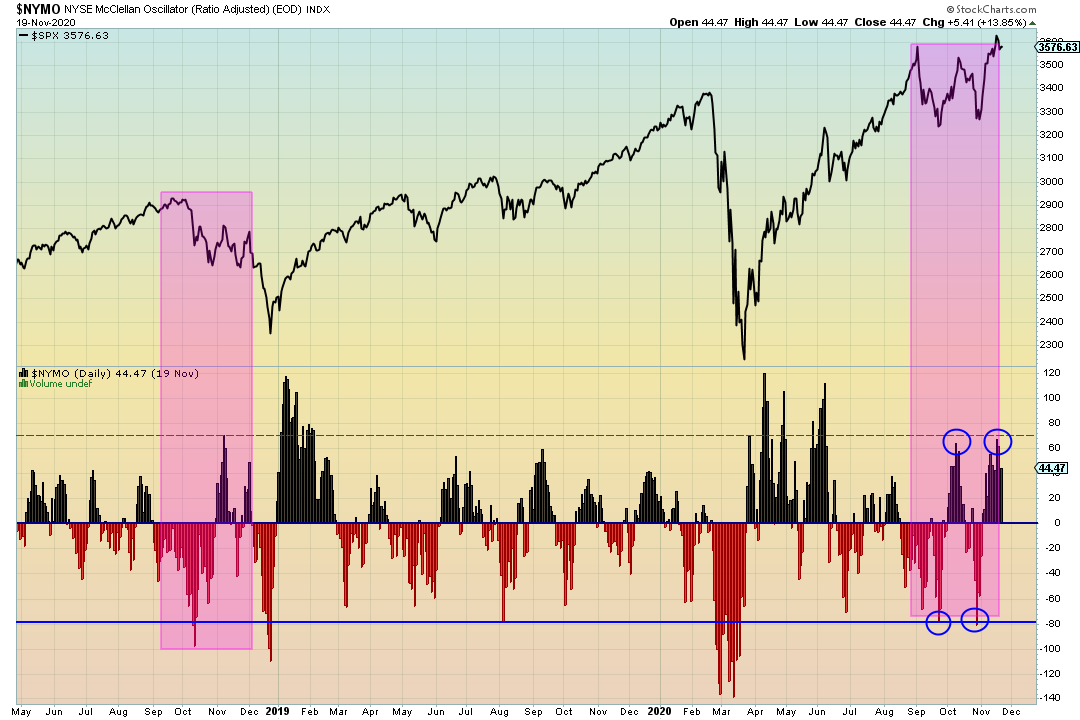
Double top on the McClellan Oscillator (Breadth Indicator). When we had a double bottom we saw a rise in price action. Perhaps the inverse will happen.
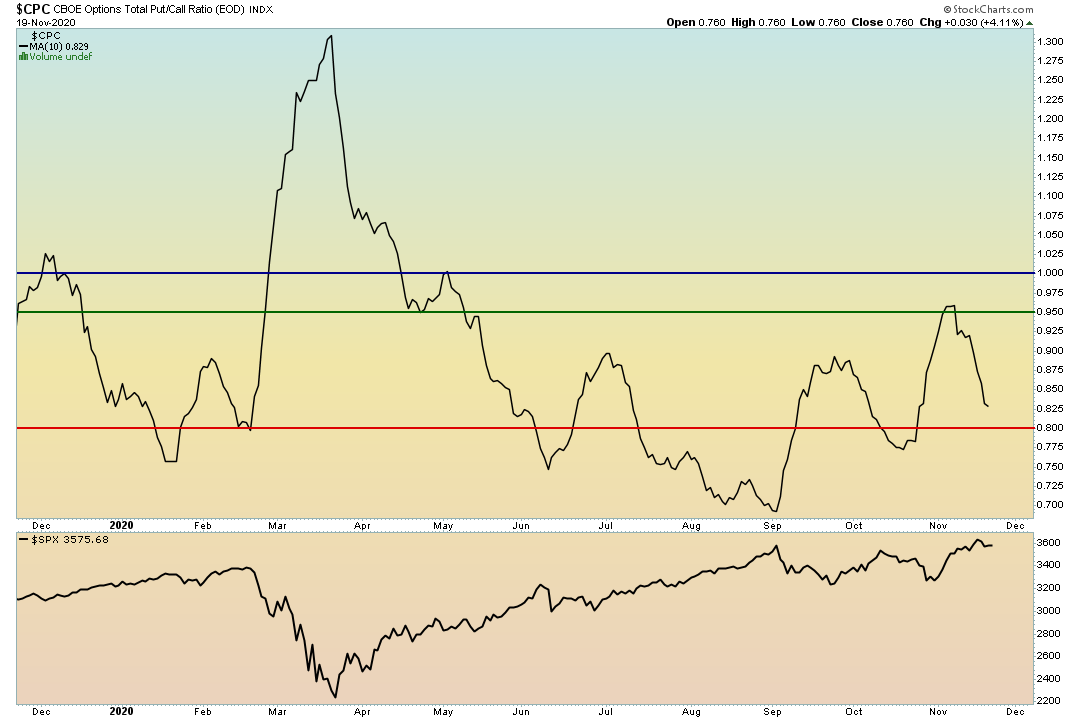
The CPC put to call ratio smoothed over a 10 SMA is heading down to the red line which would be a subtle warning that sentiment is overheating. When the CPC crosses above the red line that would be the “Sell signal” as discussed in many market briefs.
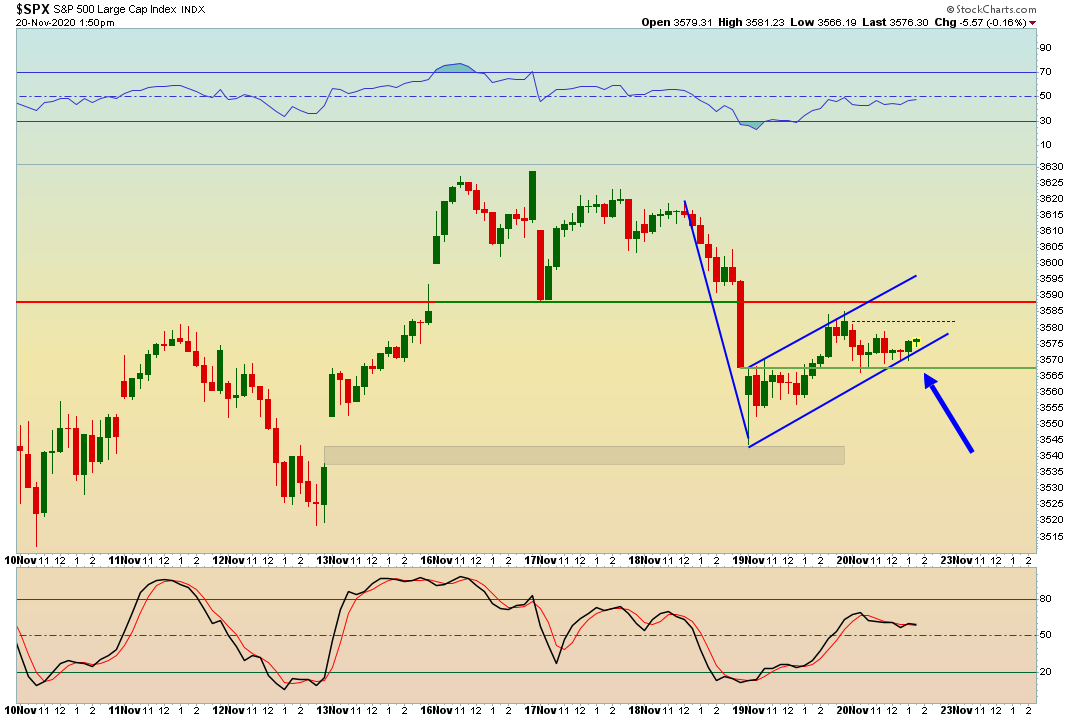
30 minute timeframe (and others) suggest a bear flag forming. Keep an eye on the possibility of a breakdown through the green support line $3570 ish.
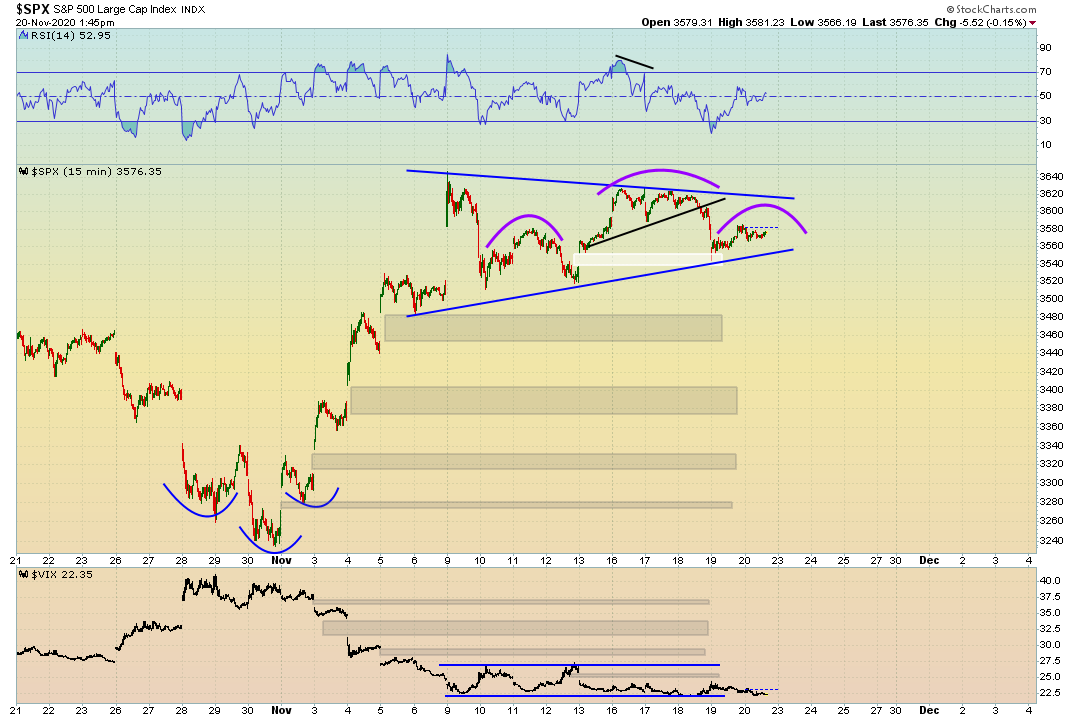
We cannot rule out the possibility for a Head & Shoulders pattern here quite yet. I didn’t draw the bear flag out on this chart, but you can see it pretty clearly.
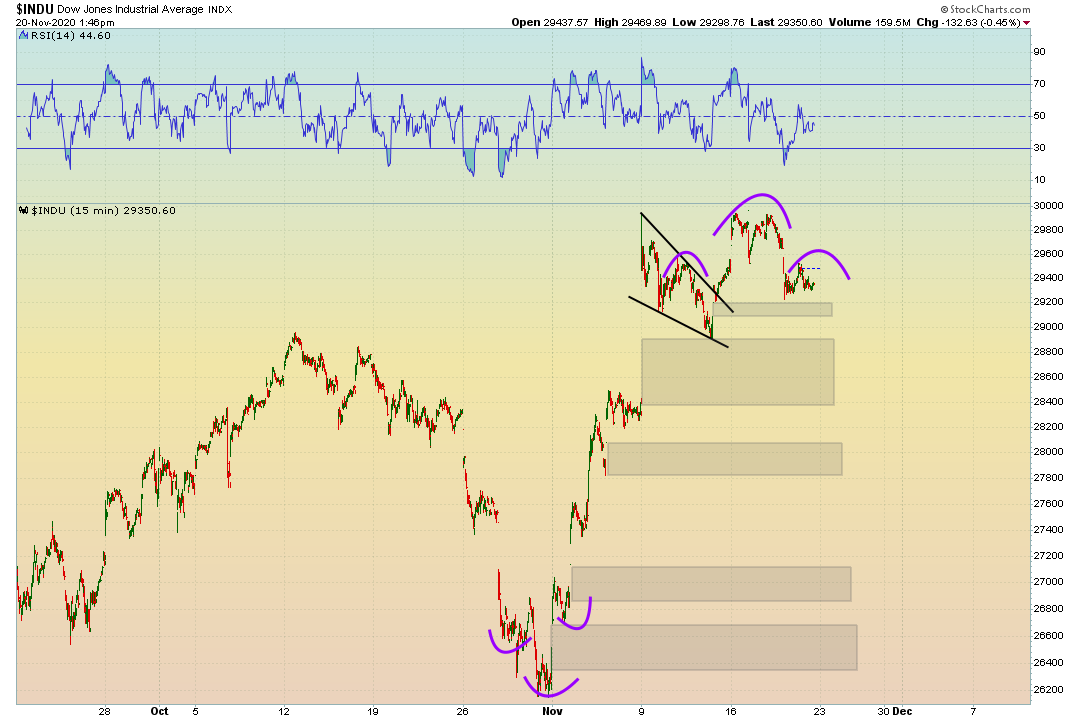
Head & Shoulders still in play. Also can argue that a Bear pennant forming hear as well.
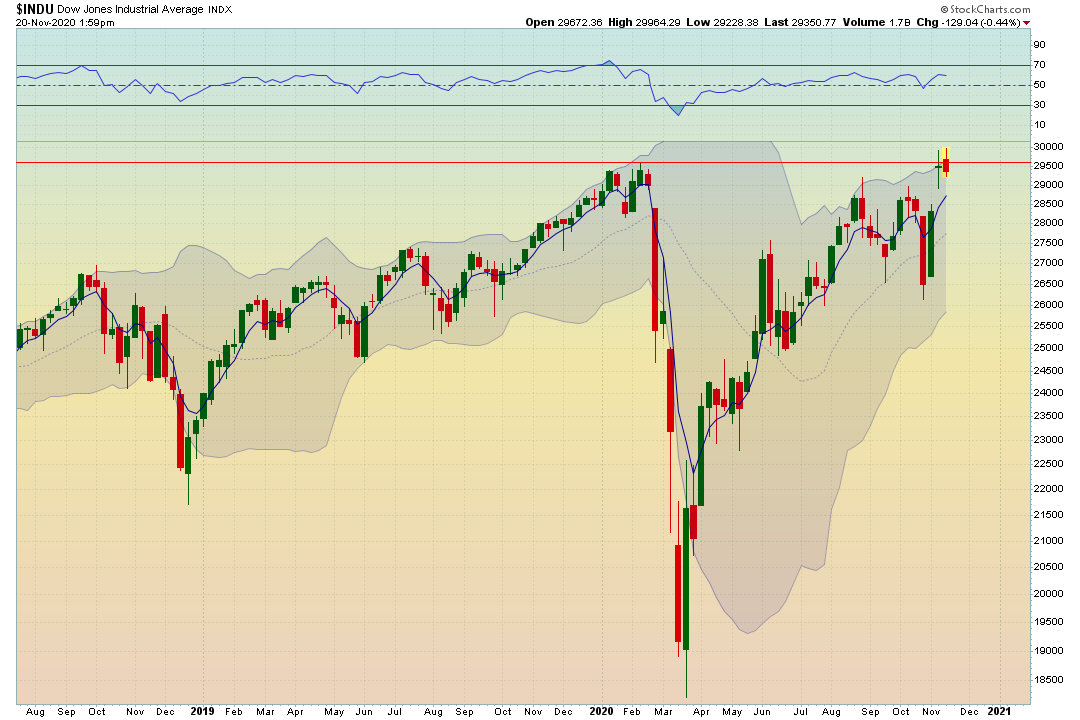
Also, important to point out the most recent weekly candle placement on this Dow Jones. Overextended on the upper bollinger band and disconnected from the 5 EMA.
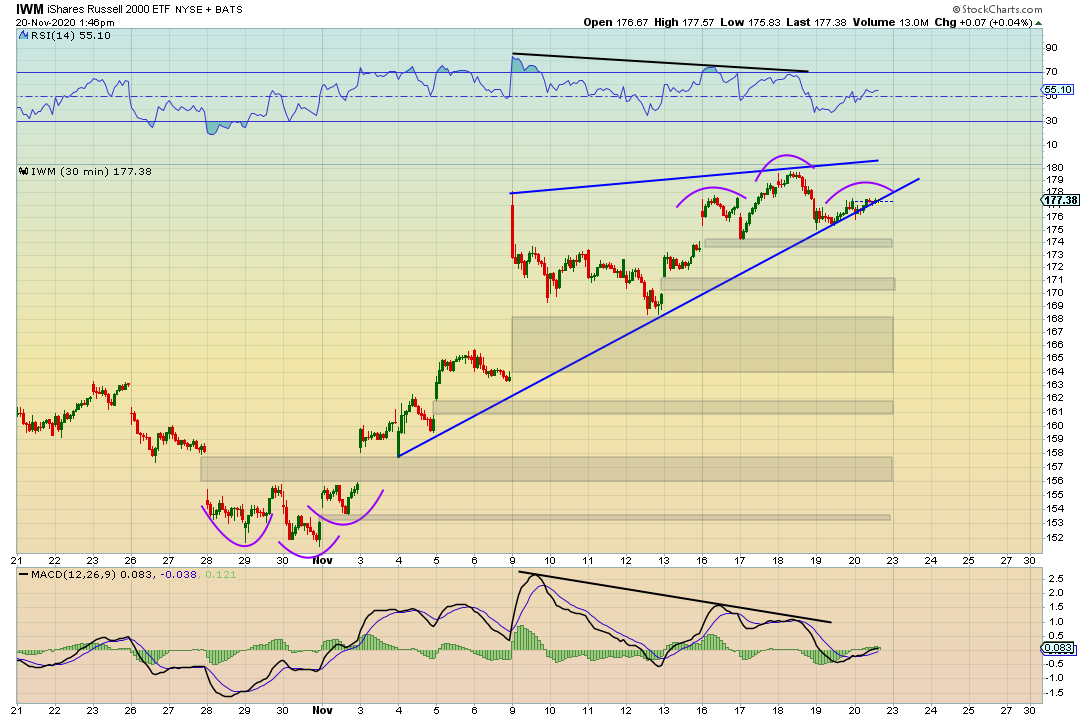
Head & Shoulders pattern still in play. Similar Bear flag pattern forming like the indices mentioned. Rising wedge on the fritz of breaking down.
Conclusion: As stated I am not trading this week. Most of the charts and indicators suggest downside risk due to the patterns, price action placement, and patterns. However, I find it interesting that the futures market sold off with the news around the treasury secretary, and then as soon as morning came stimulus optimism was right back on the table. Interesting times we live in. This Market has still the possibility to run higher and get further extended to the upside, It just looks to me like we are setting ourselves up for a very very bumpy ride.