12/11/2020 9:30 AM
Well, well, well, the VIX did NOT go down today as it typically does on a Friday. We are showing some increased Volatility. This can be in due part to Brexit talks and stimulus.
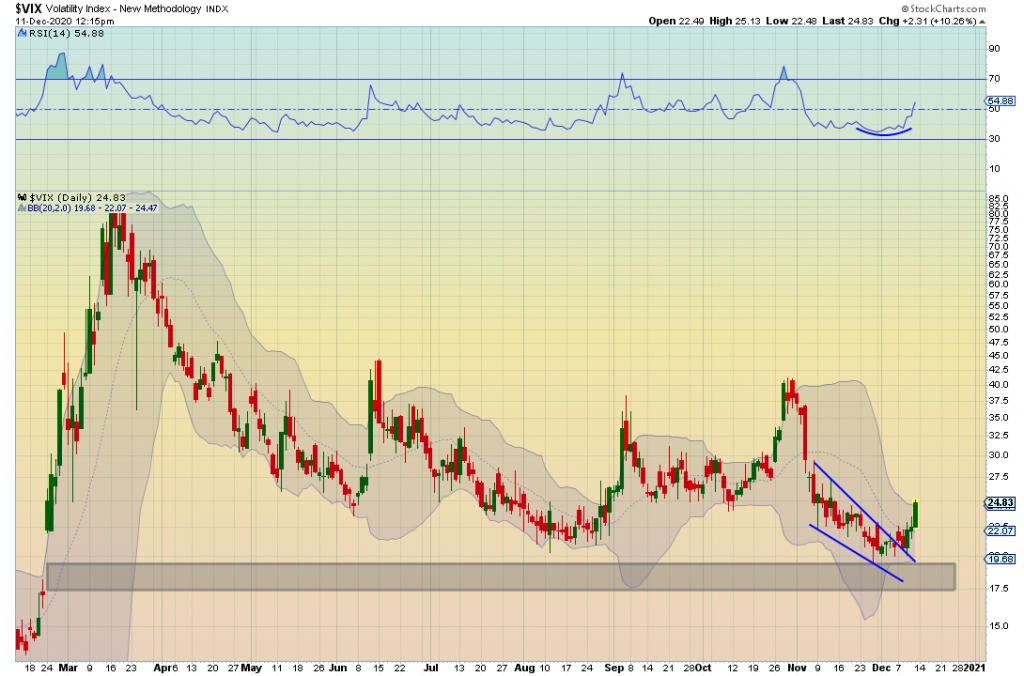
We are tagging the upper range of the bollinger band, so we might see it pull back just a little. However, we have seen countless times that it can stay over extended for periods at a time. My original target was 27.5 when breaking out of this pattern.
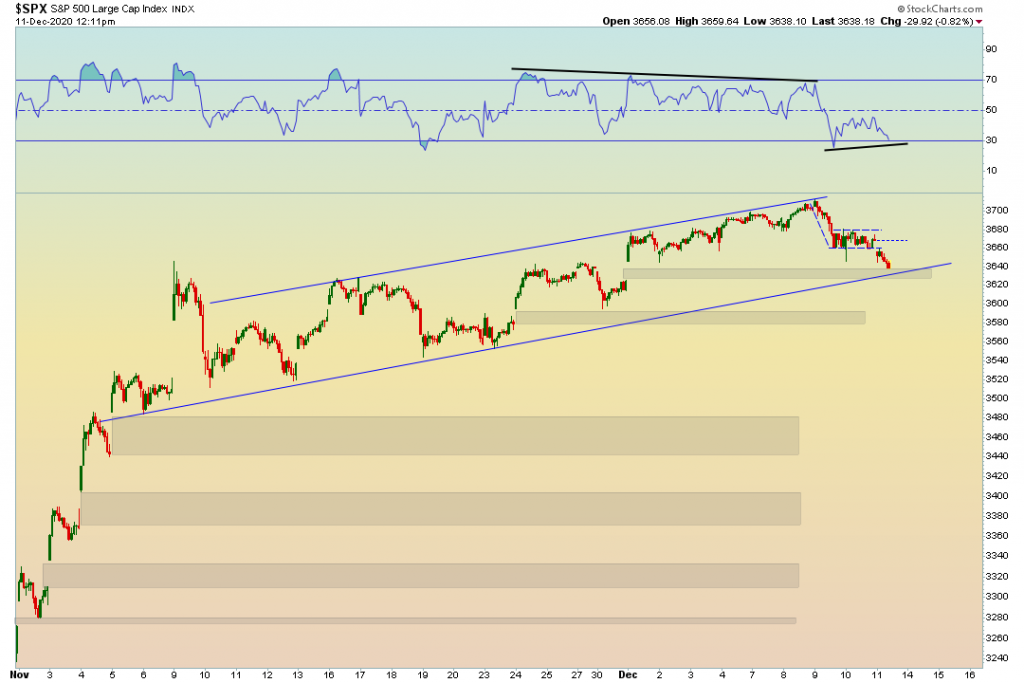
The S&P 500 broke down from the bear flag as warned about on twitter yesterday. What I want you to watch now is the positive divergence currently developing on the RSI, the gap, and the lower trend line. This is quite a bit of confluence for support to potentially hold. We will see. If we breakdown then there can be an increased likelihood of increased selling pressure.
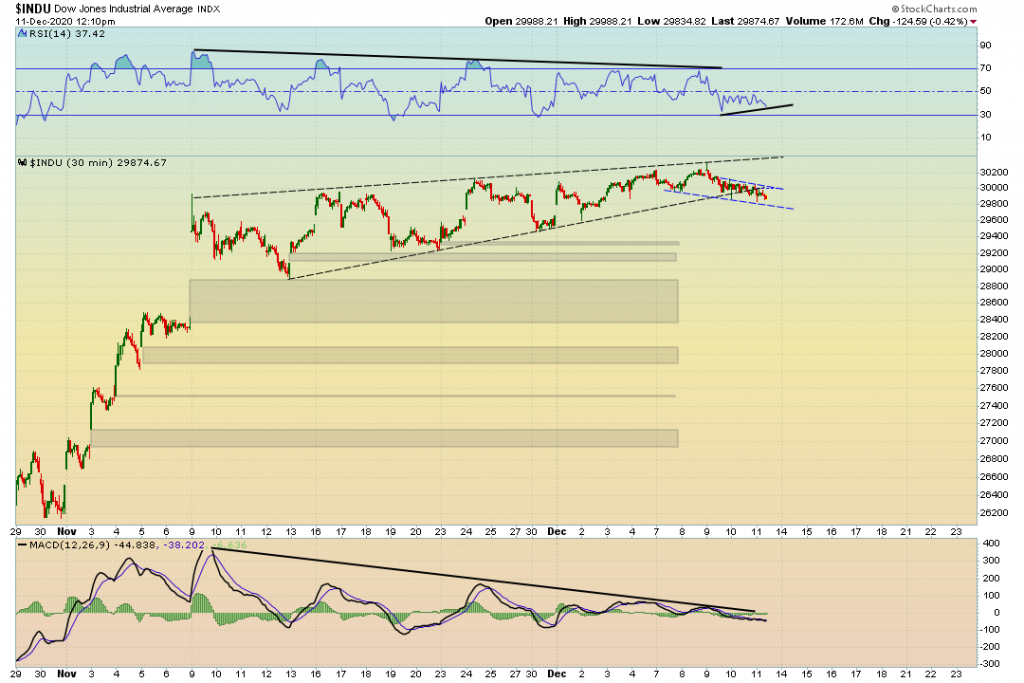
Dow Jones Industrial Average broke down from the rising wedge. Its currently in a short term bear channel in overall bullish context. The RSI currently has a positive divergence as well.
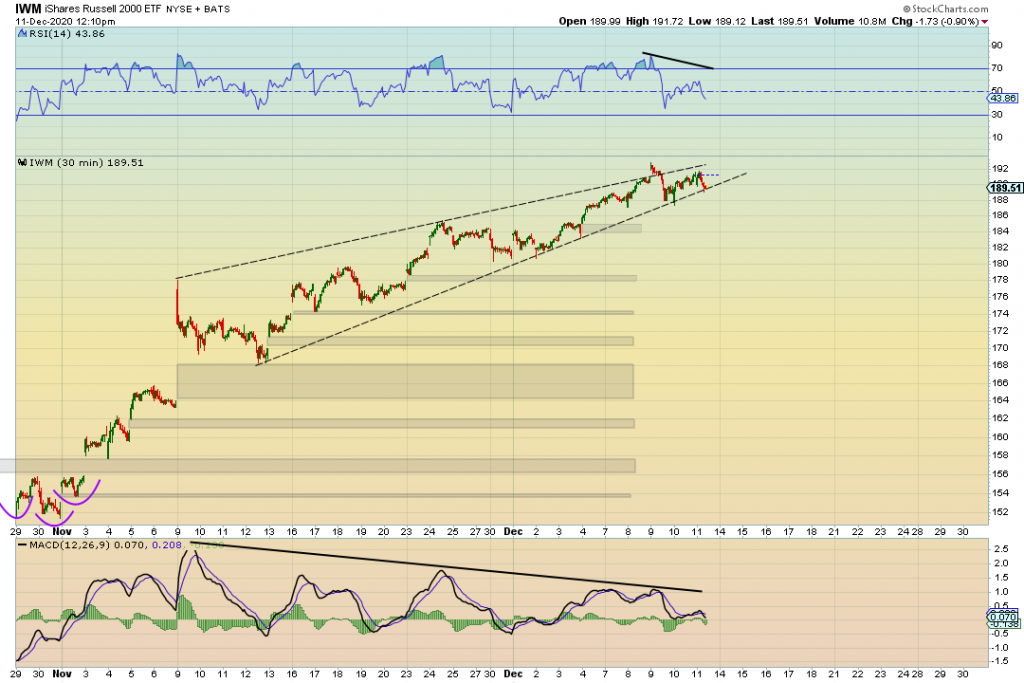
The IWM is still tightly coiling up in a rising wedge pattern. The gap down today happened to get bought up immediately again. Right now the price action is testing the lower trendline again.
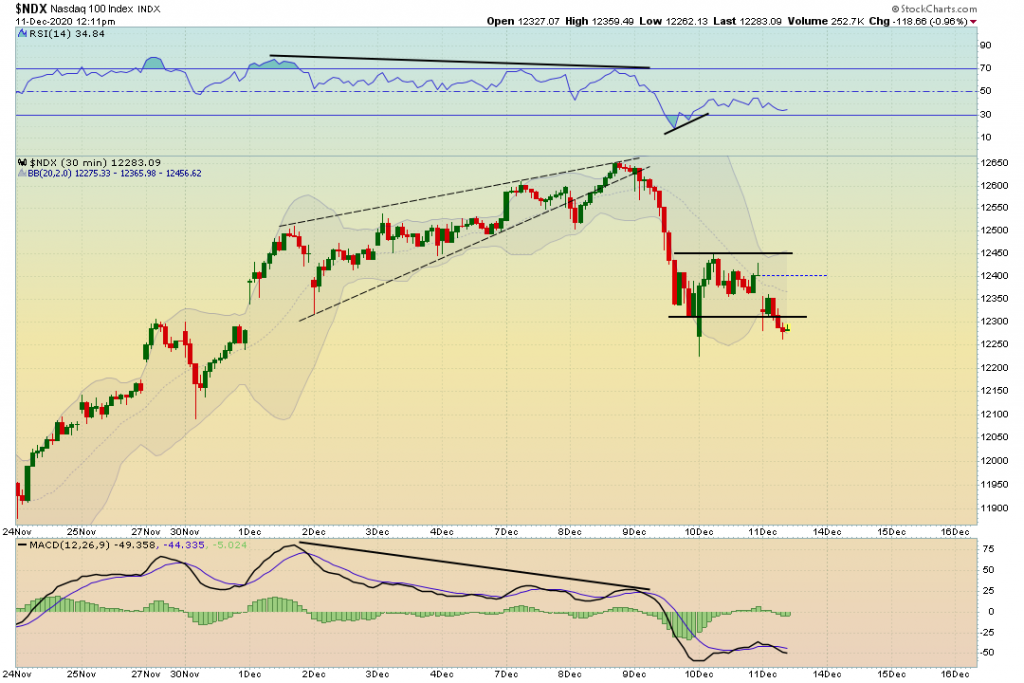
The Nasdaq 100 broke down from this channel. There is some strong support still on the daily timeframe at 12200. Be mindful of the support.
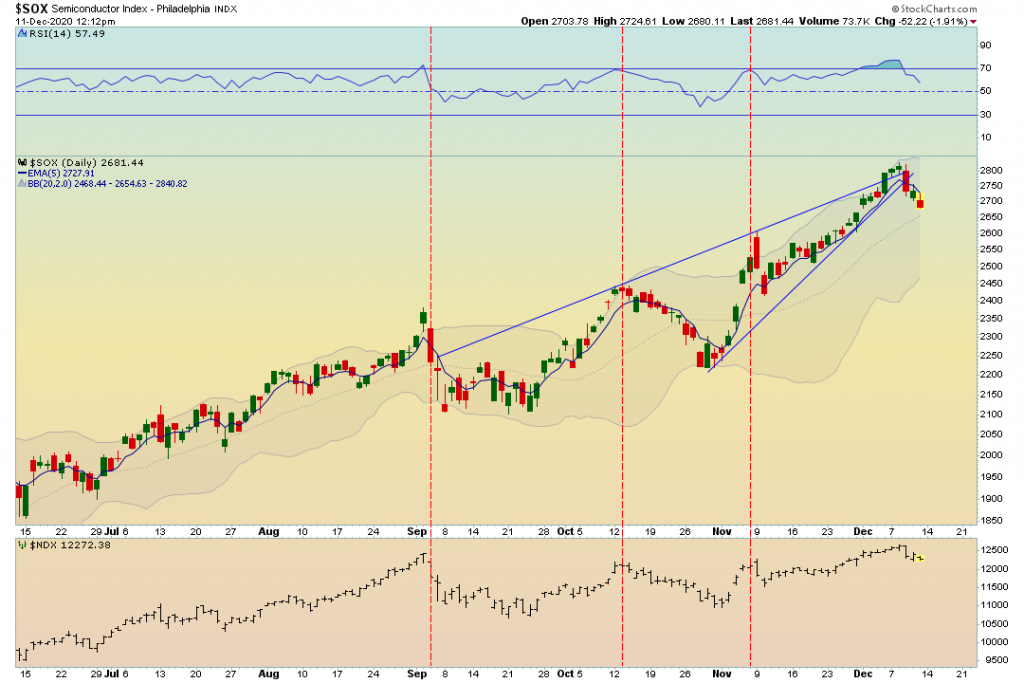
The Semiconductor Index makes up a big portion of the Nasdaq. Its difficult for the nasdaq to push higher if it doesn’t have support form the Semis. Currently the bears have control of the 5 EMA and we broke the rising wedge structure. Might find support at the 20 SMA.
My thoughts: Its Friday and we are seeing lots of uncertainties. Not just in price action, but also in the news. Next week we have the fed speaking and I belive OPEX. If we get continued selling, we might see follow through on Monday. I am being very careful and patient in these times.
12/9/2020 11:40 AM
Stairs up and elevator down today. Started the day on a positive note with a gap up, however quickly reversed that trend into some weakness. I mentioned the possibility of this on yesterday’s market brief.
The question now on everyone’s mind is…Is the beginning of the “Sell off”. To be completely honest, nobody should have an answer to that question. If they do, then they are taking a complete guess.
Let’s look at some charts to determine what might take place next.
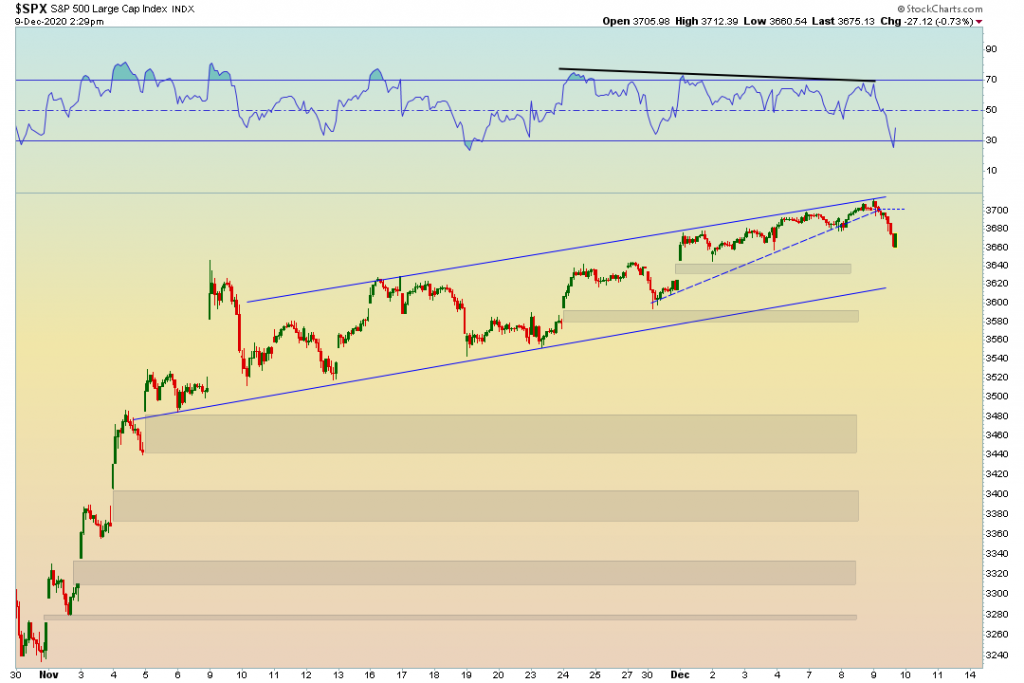
The S&P 500 became very oversold running into the previous gap and we are seeing a bounce take place. Whether that is sustainable or not remains to be seen.
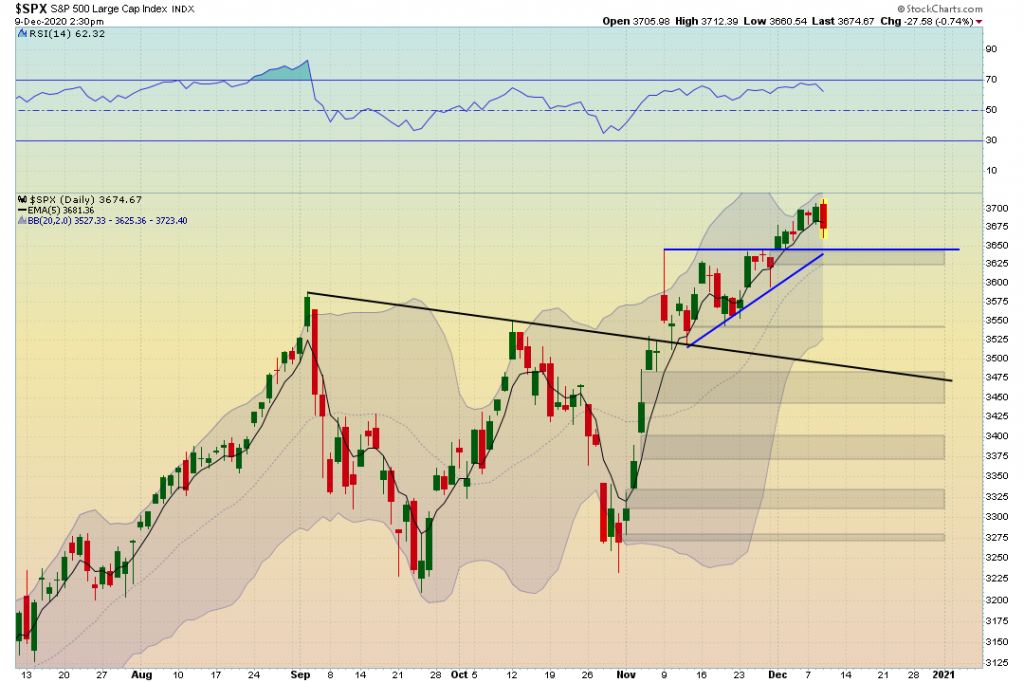
On the daily timeframe, the bears overtook the 5 ema as of now. Typically when this happens, the bulls bid it right back up. So I wouldn’t be surprised to see the price action ramp back up
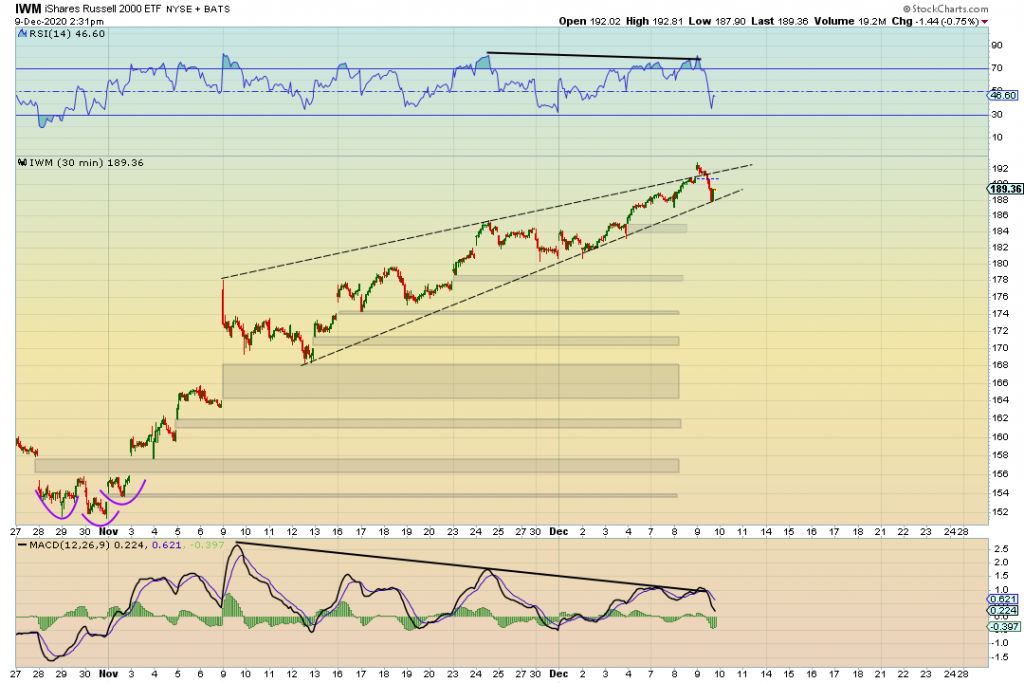
The short hedge I placed on the IWM (Russell 2000) was partially scaled out of today. notice the price action bouncing from the lower trend.
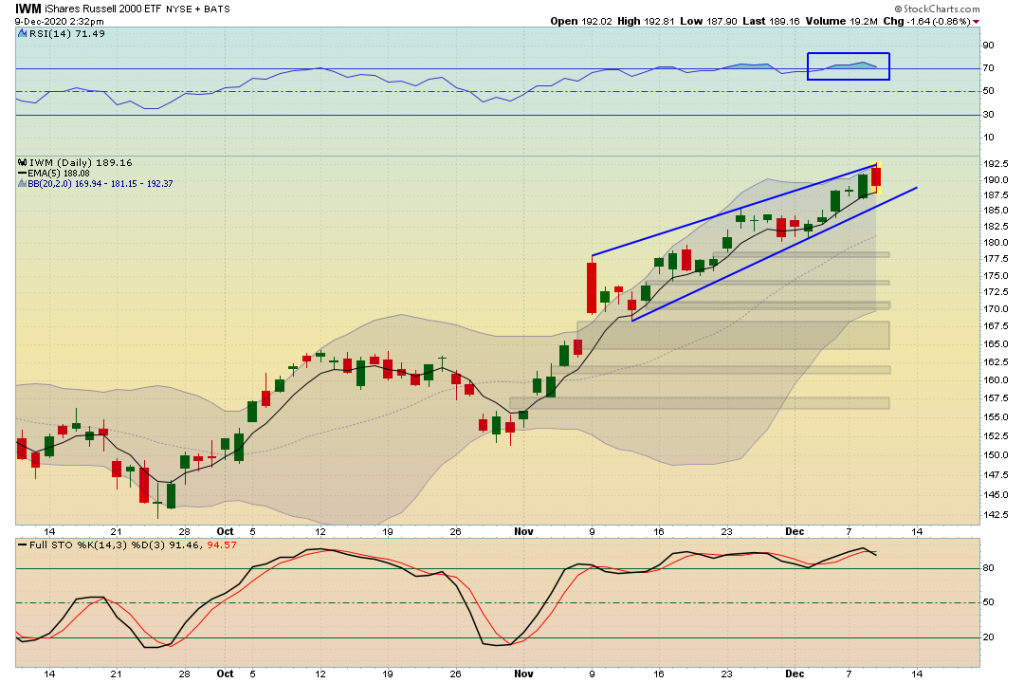
Also, take note that on the daily the IWM bounced perfectly of the 5 EMA.
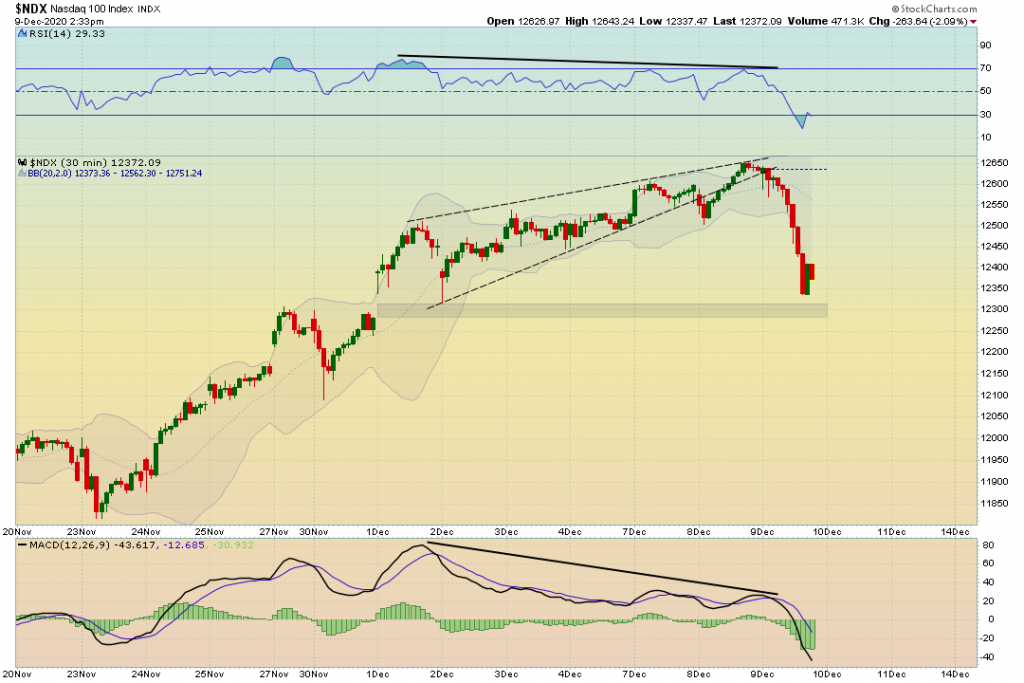
The Nasdaq 100 became very oversold and is bouncing right near the previous gap. This could be a good long entry point for this very strong index, or it can be a dead cat bounce.
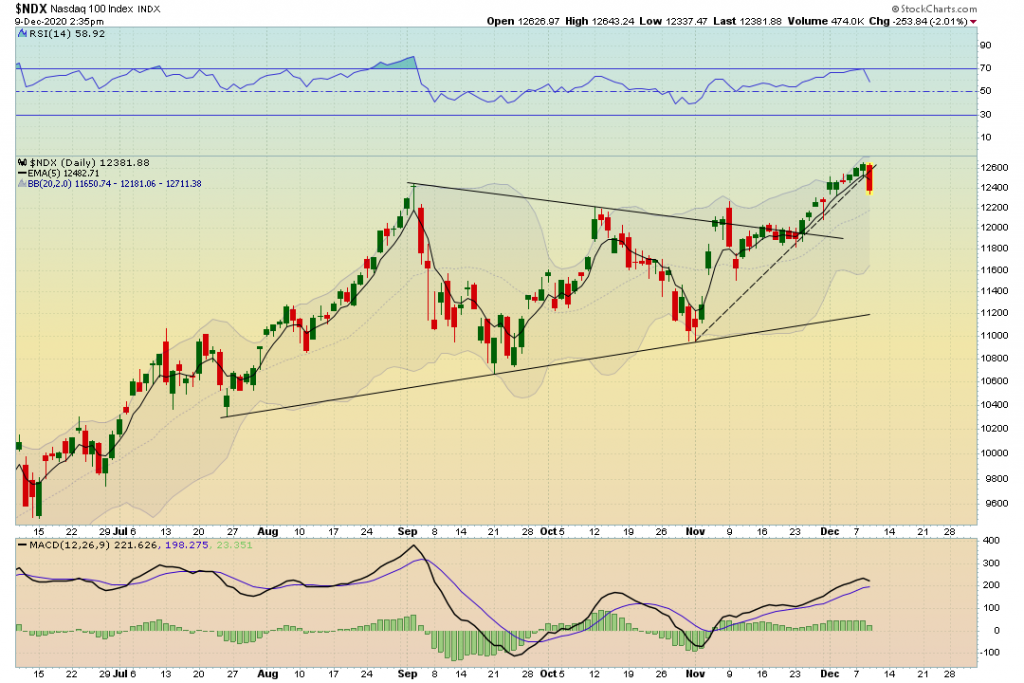
This is the Daily on the NDX, and boy o boy that is one nasty candle. Broke right through that aggressive trendline we have been talking about and is currently below the 5 EMA.
MY THOUGHTS: The 5 EMA on the daily has been getting bought up as soon as it reconnects. We need to see confirmation in order to know if this is the start of a potential real pullback. At this moment in time, we are witnessing what “Stairs up, Elevator down” looks like. The NDX in less than a day wiped out 6 days of progress. If selling pressure intensifies, it can get a lot worse and we can fill lots of those gaps we have been talking about.
Looking forward to today’s brief!

