
1/6/2021 9:30 AM
All the crazy price action that we are seeing today, and in the overnight session is most likely due to the Georgia Senate race. I discussed this in yesterday’s brief that it was going to be considered very bullish, and or very bearish. Judging by the markets reaction in the futures market Its safe to say that the market is interpreting the current news as very bullish.
Russell 2000 had a massive gap up and now is on a relentless ramp higher
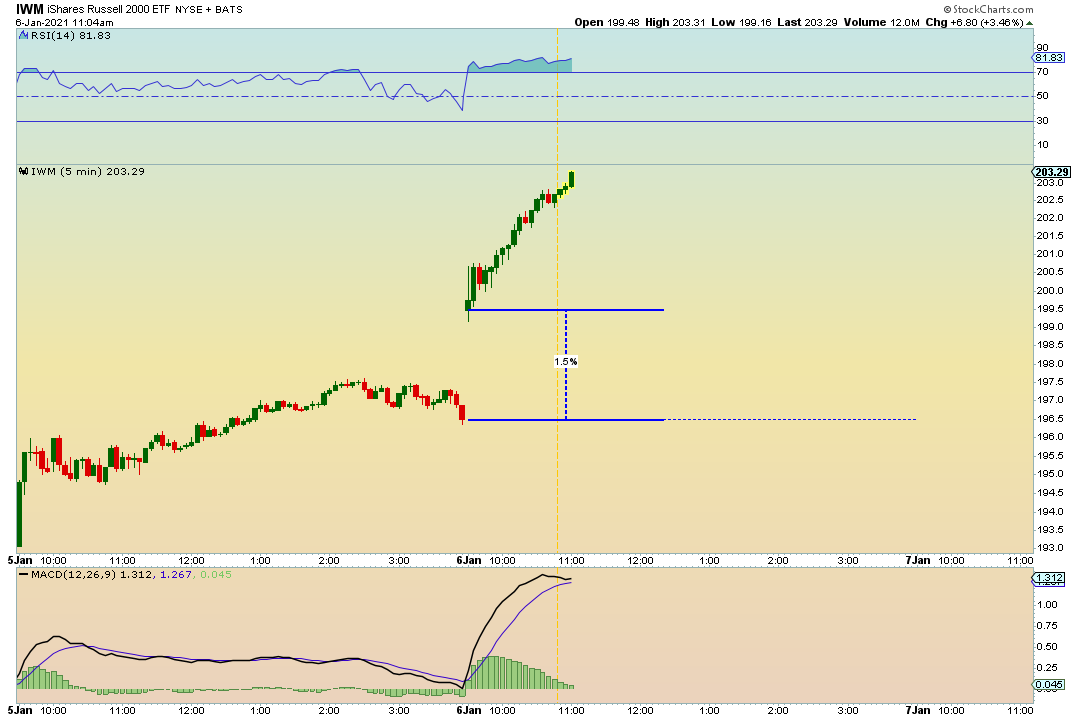
Perhaps small caps are enjoying this because it looks like the dems have taken control of the senate and are interpreting this news as more stimulus is coming and the market will be bid up even higher.
What’s interesting is that Nasdaq gapped down.
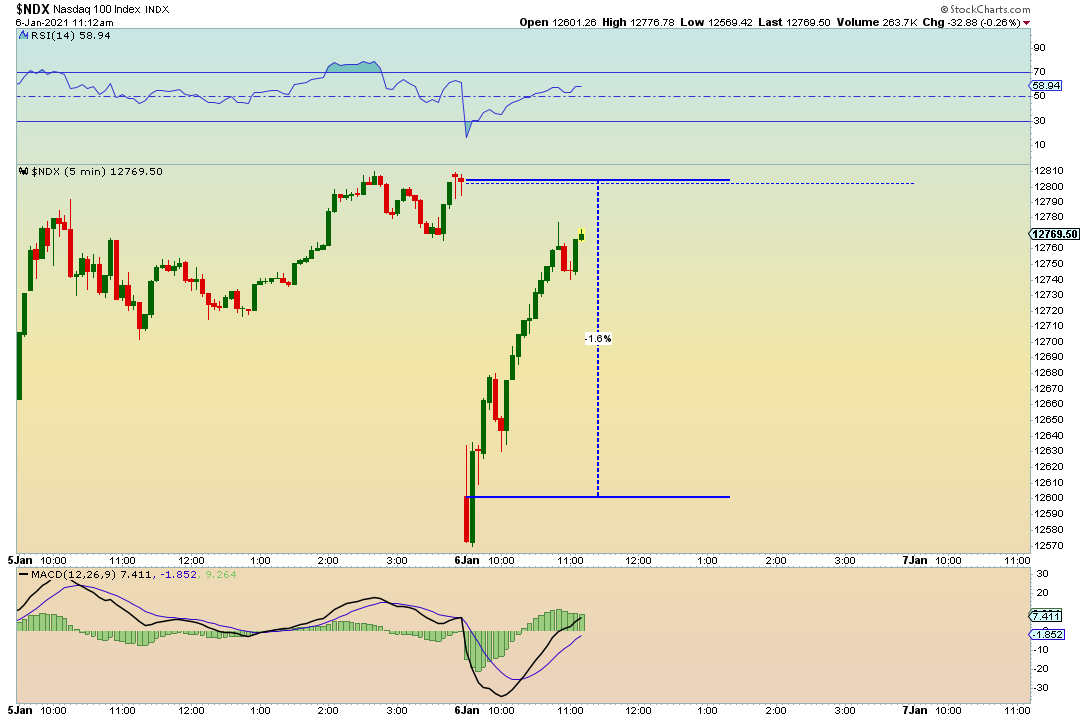
Perhaps tech is taking this news poorly. Will there be more restrictions to come with a democratic ran senate? I’m not sure, but this seem to be recovering rather rapidly anyway.
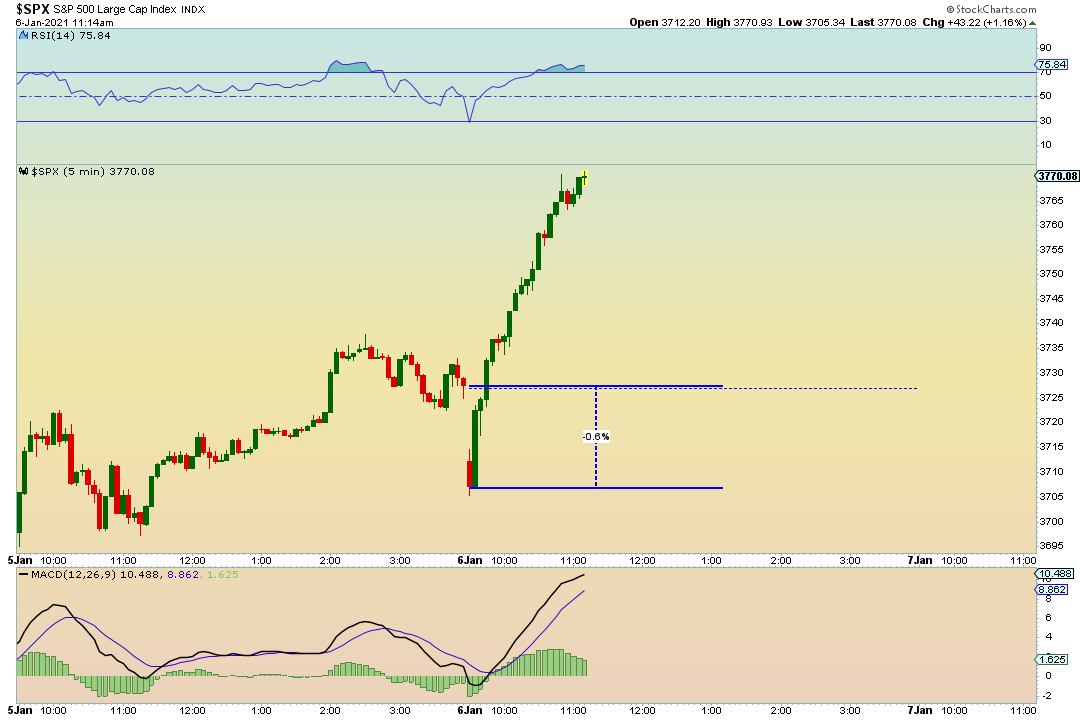
SPX had a little gap down as well with a vertical recovery.
All this crazy price action at the moment is largely indue part of the noise around all the the current political atmosphere. We also have the Trump march to keep an eye on. Not sure if anything is going to come from it but its still important to note.
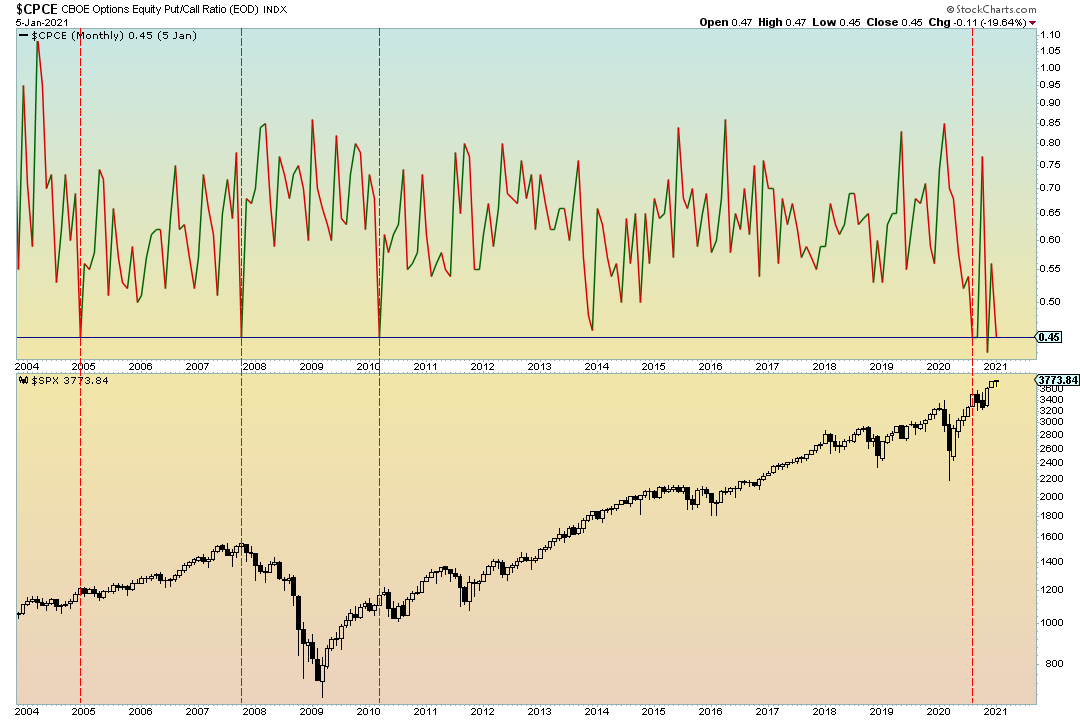
Its always a good idea to zoom out and look at the bigger picture to get a better understanding where the markets may head.
From a Monthly perspective the market is in Full bull mode. We can see this with a chart of the Monthly CPCE.
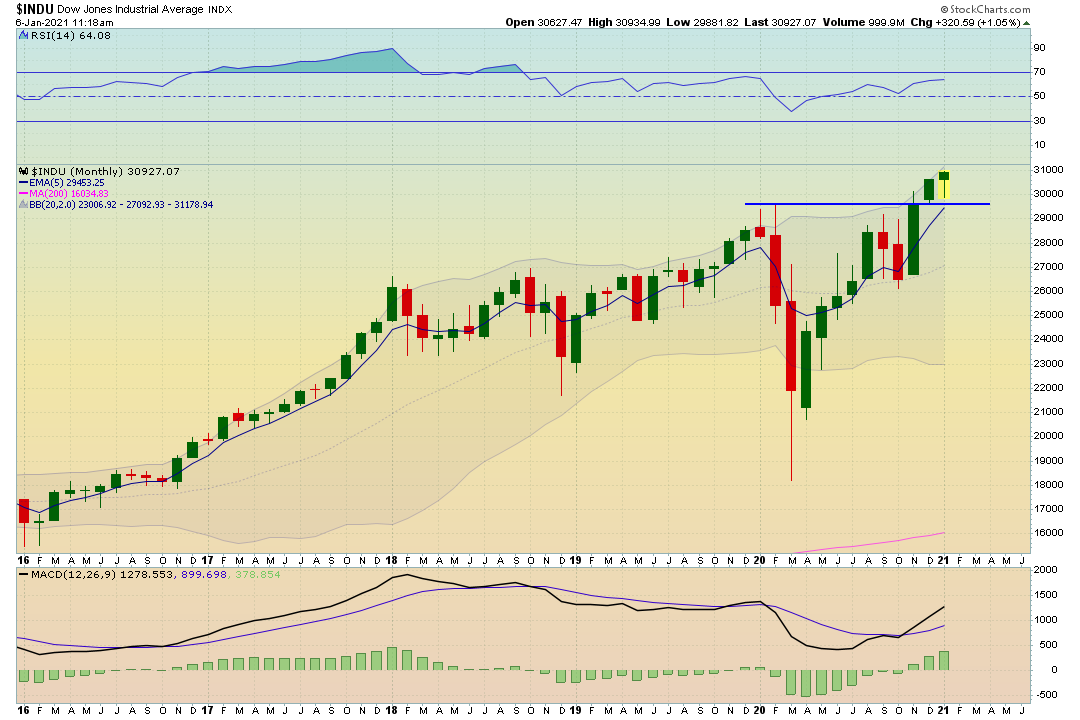
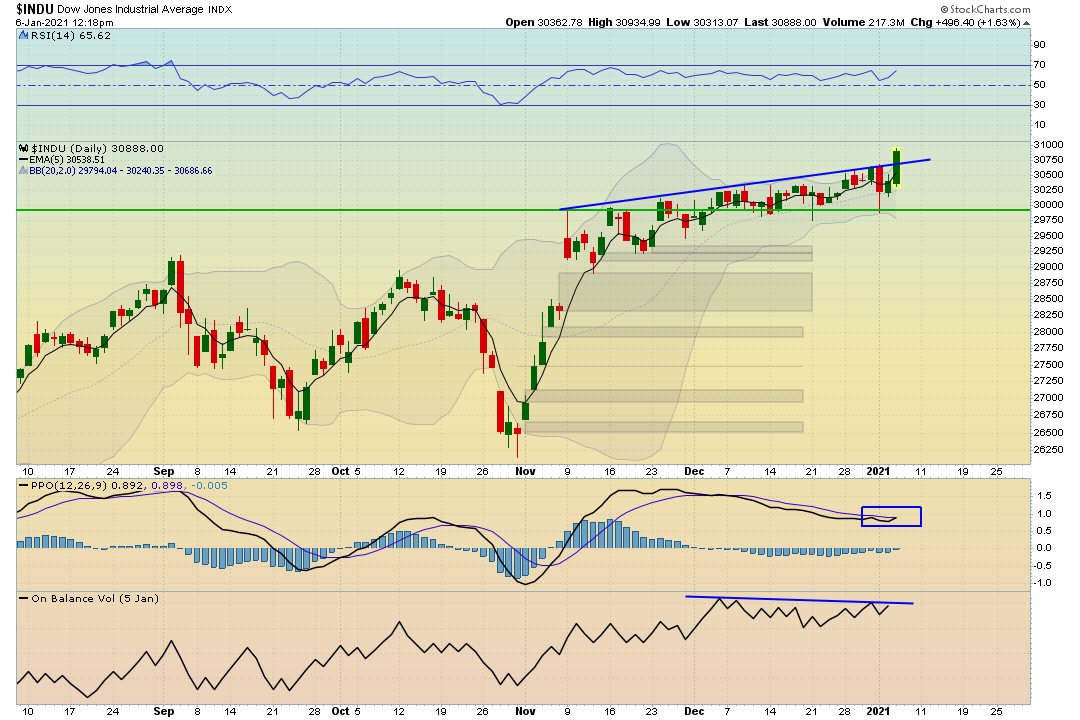
The industrials are showing continued strength on this breakout.
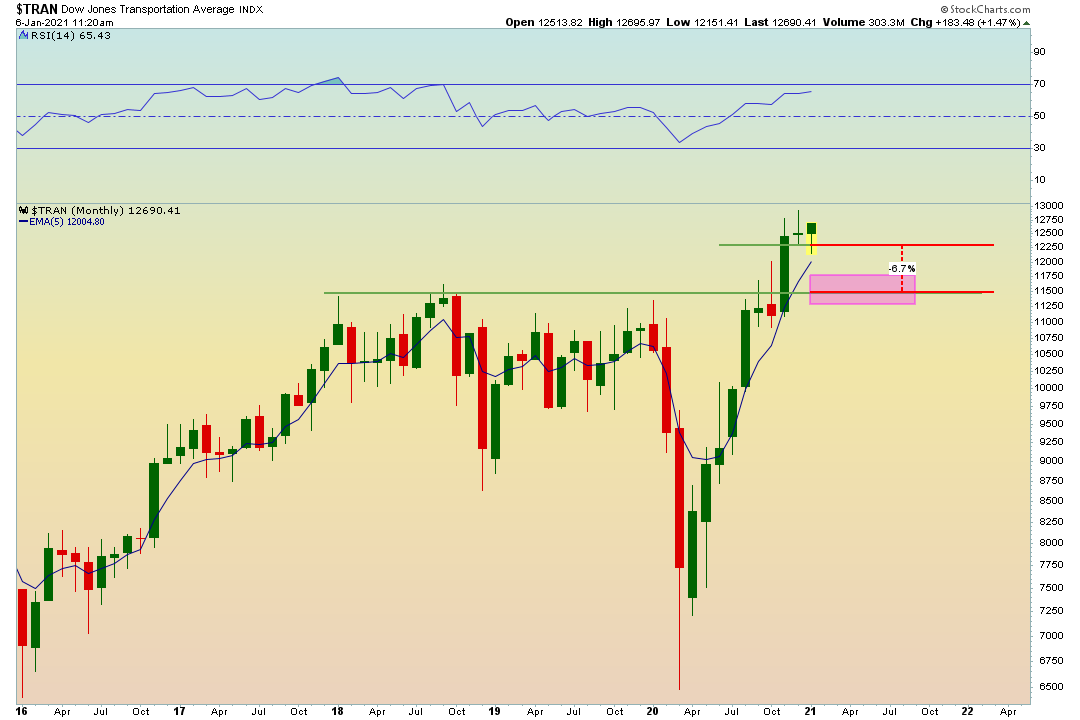
Transports showed weakness at the beginning of the month but currently are at the high point for the month well above the 5 EMA but not yet testing the all time highs.
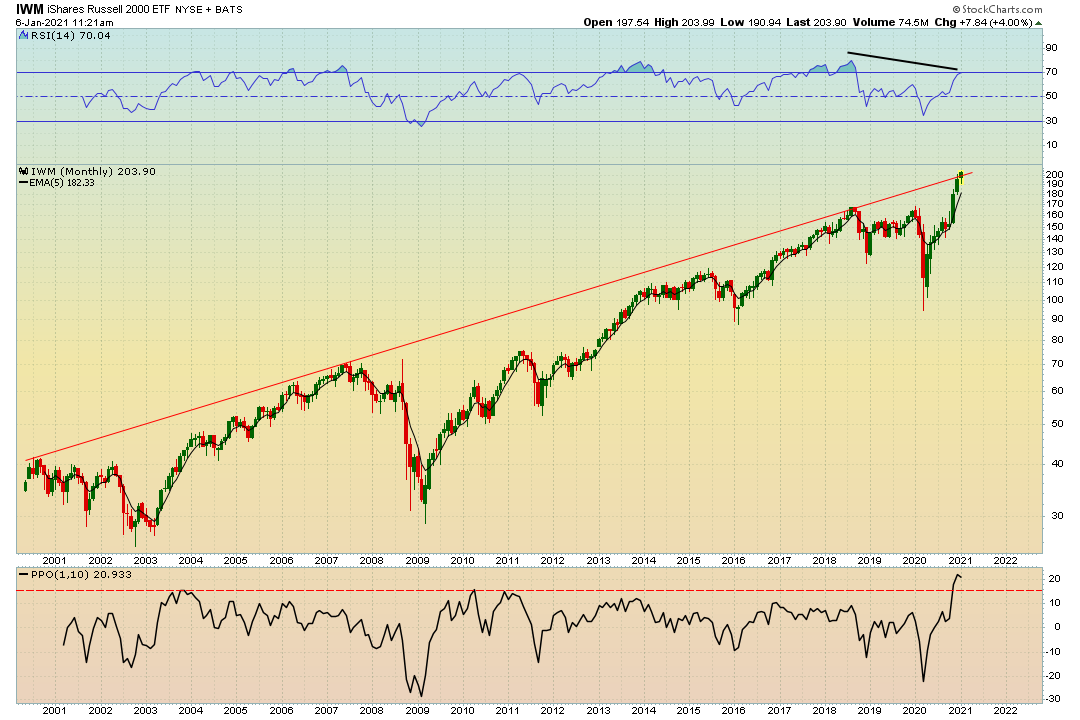
The Russell 2000 (IWM) has recently broken through its long term resistance. This can be interpreted in two different way. Very bullish and this move is just starting, or It can be a blow off top / melt up given its over extension levels.
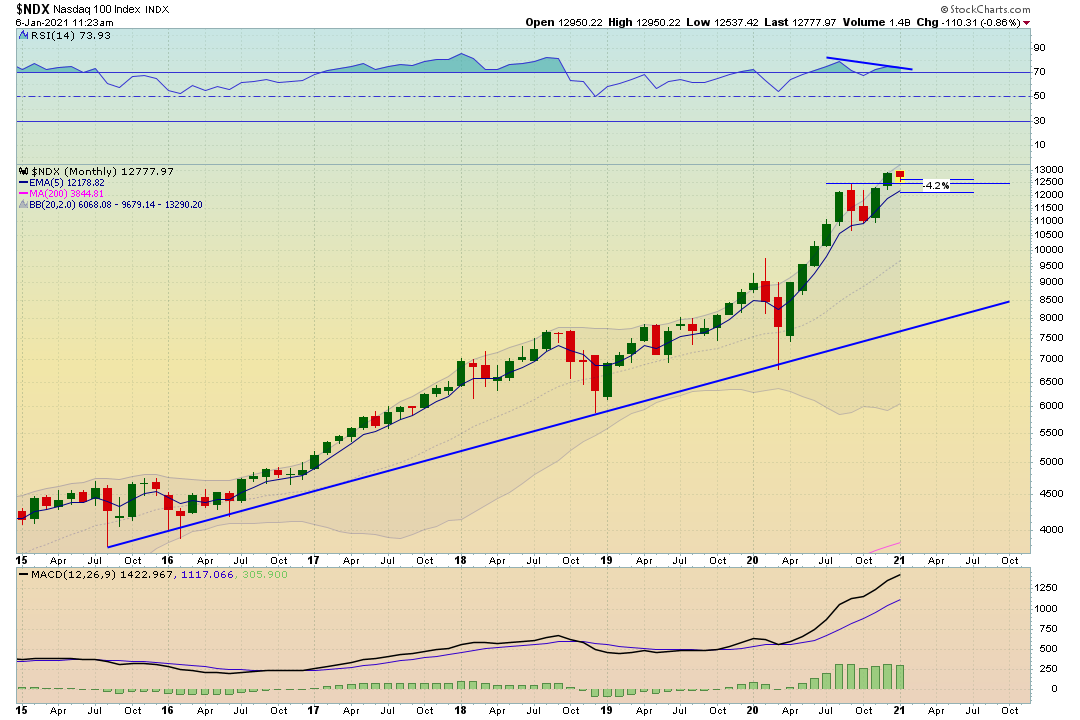
The NDX is seeing some subtle weakness for the start of the month, but still remains above key levels
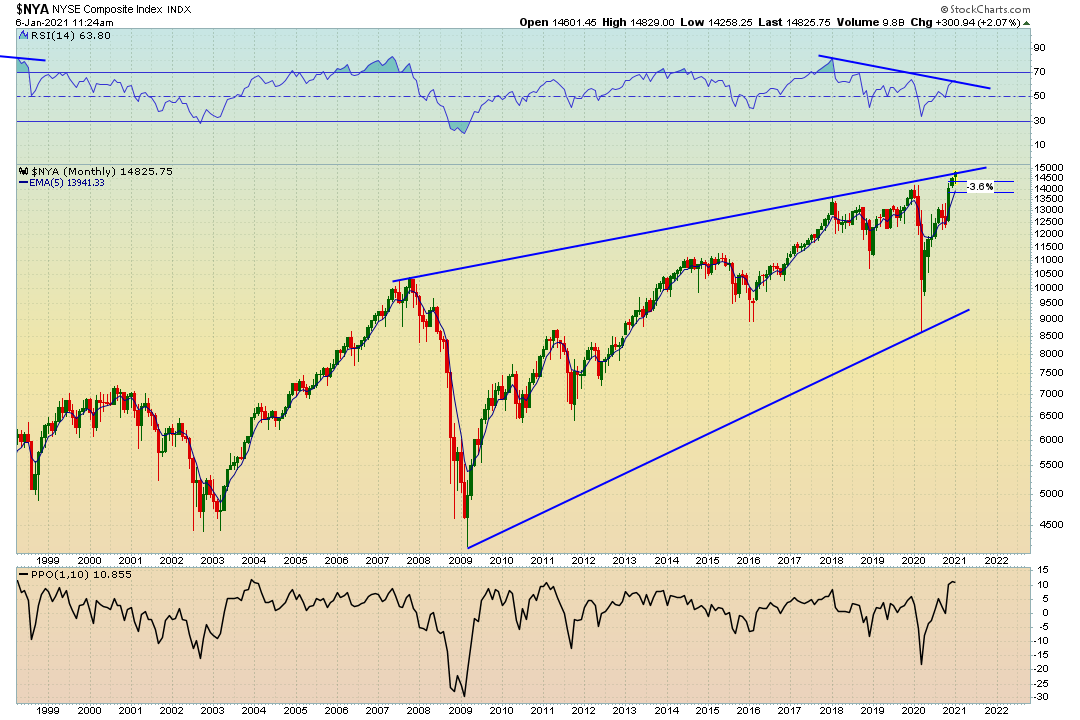
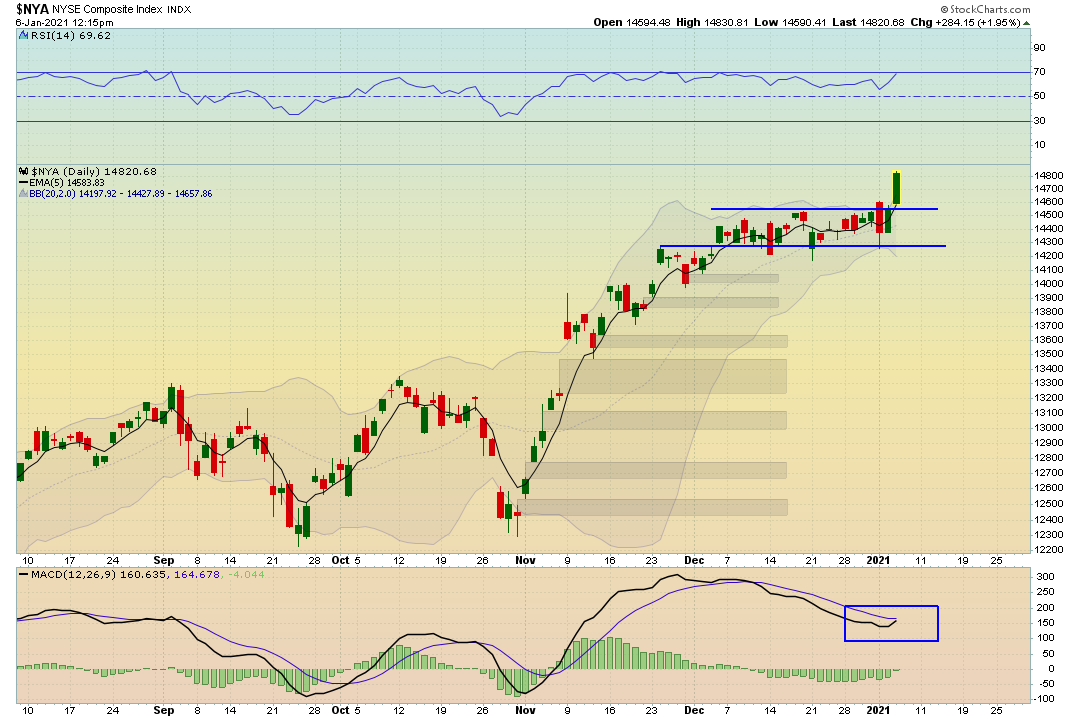
The NYSE (NYA) is breaking out of long term resistance and also can be interpreted the same way as stated for the IWM. Its also important to note the current negative divergence. This means we are seeing higher highs with the price action with weaker relative strength.
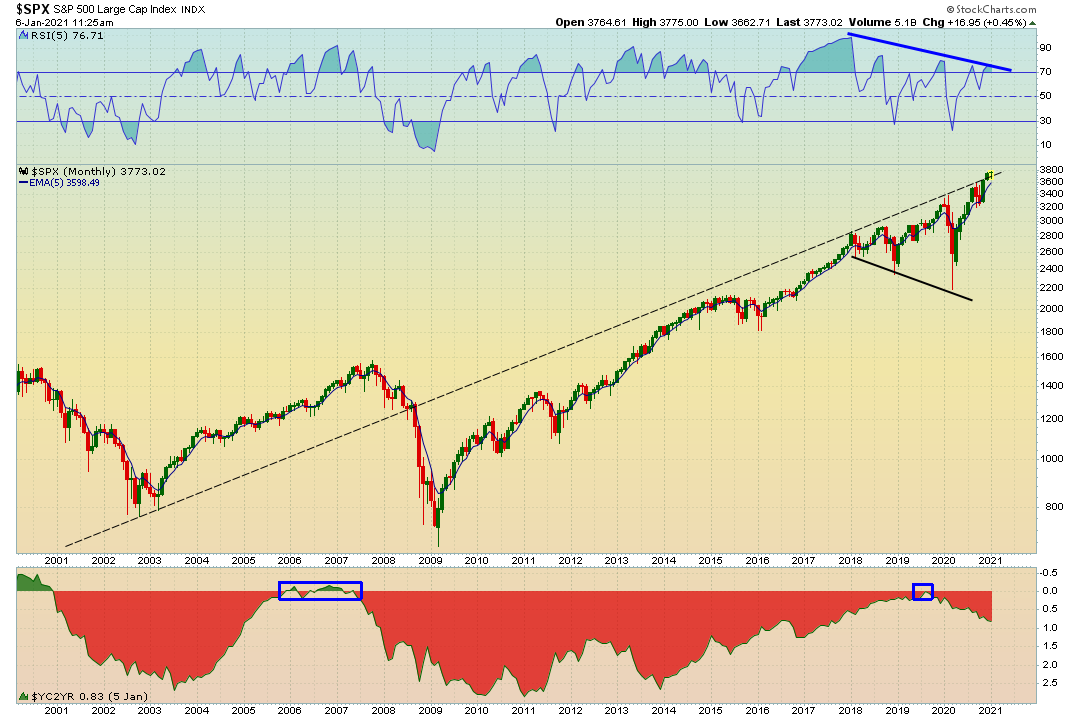
The SPX also can be interpreted the same way as both the IWM & the NYSE.
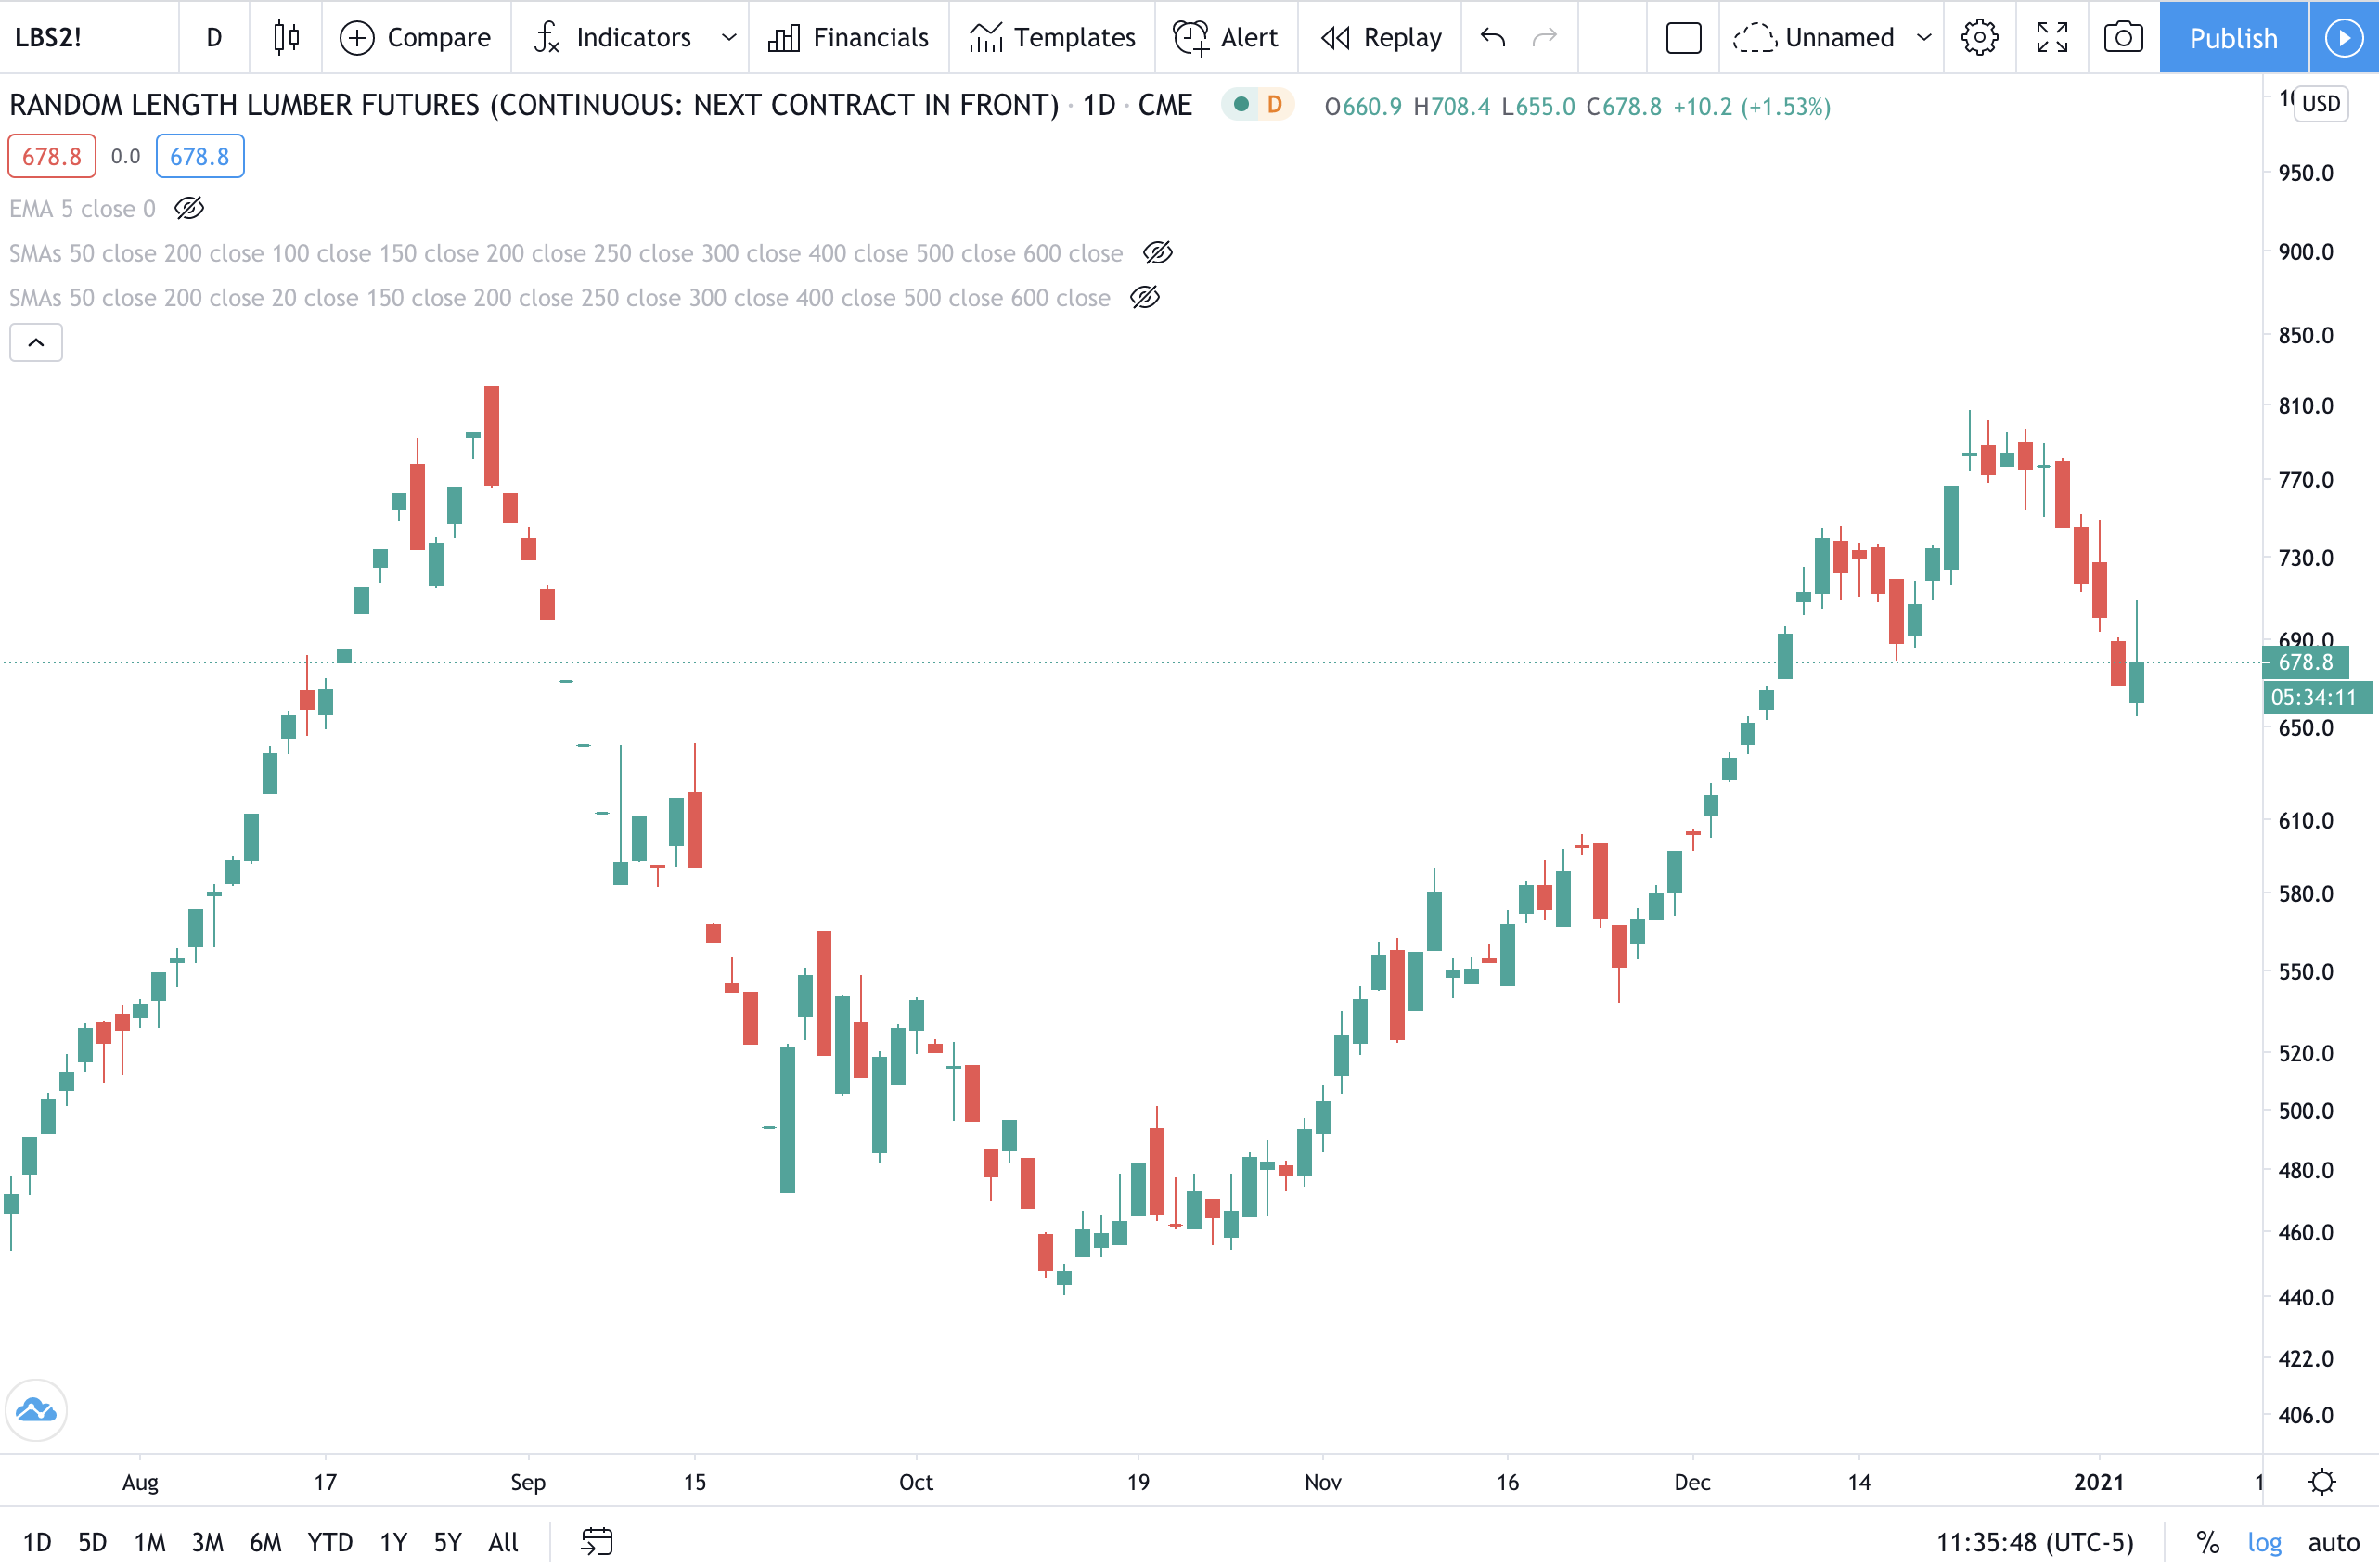
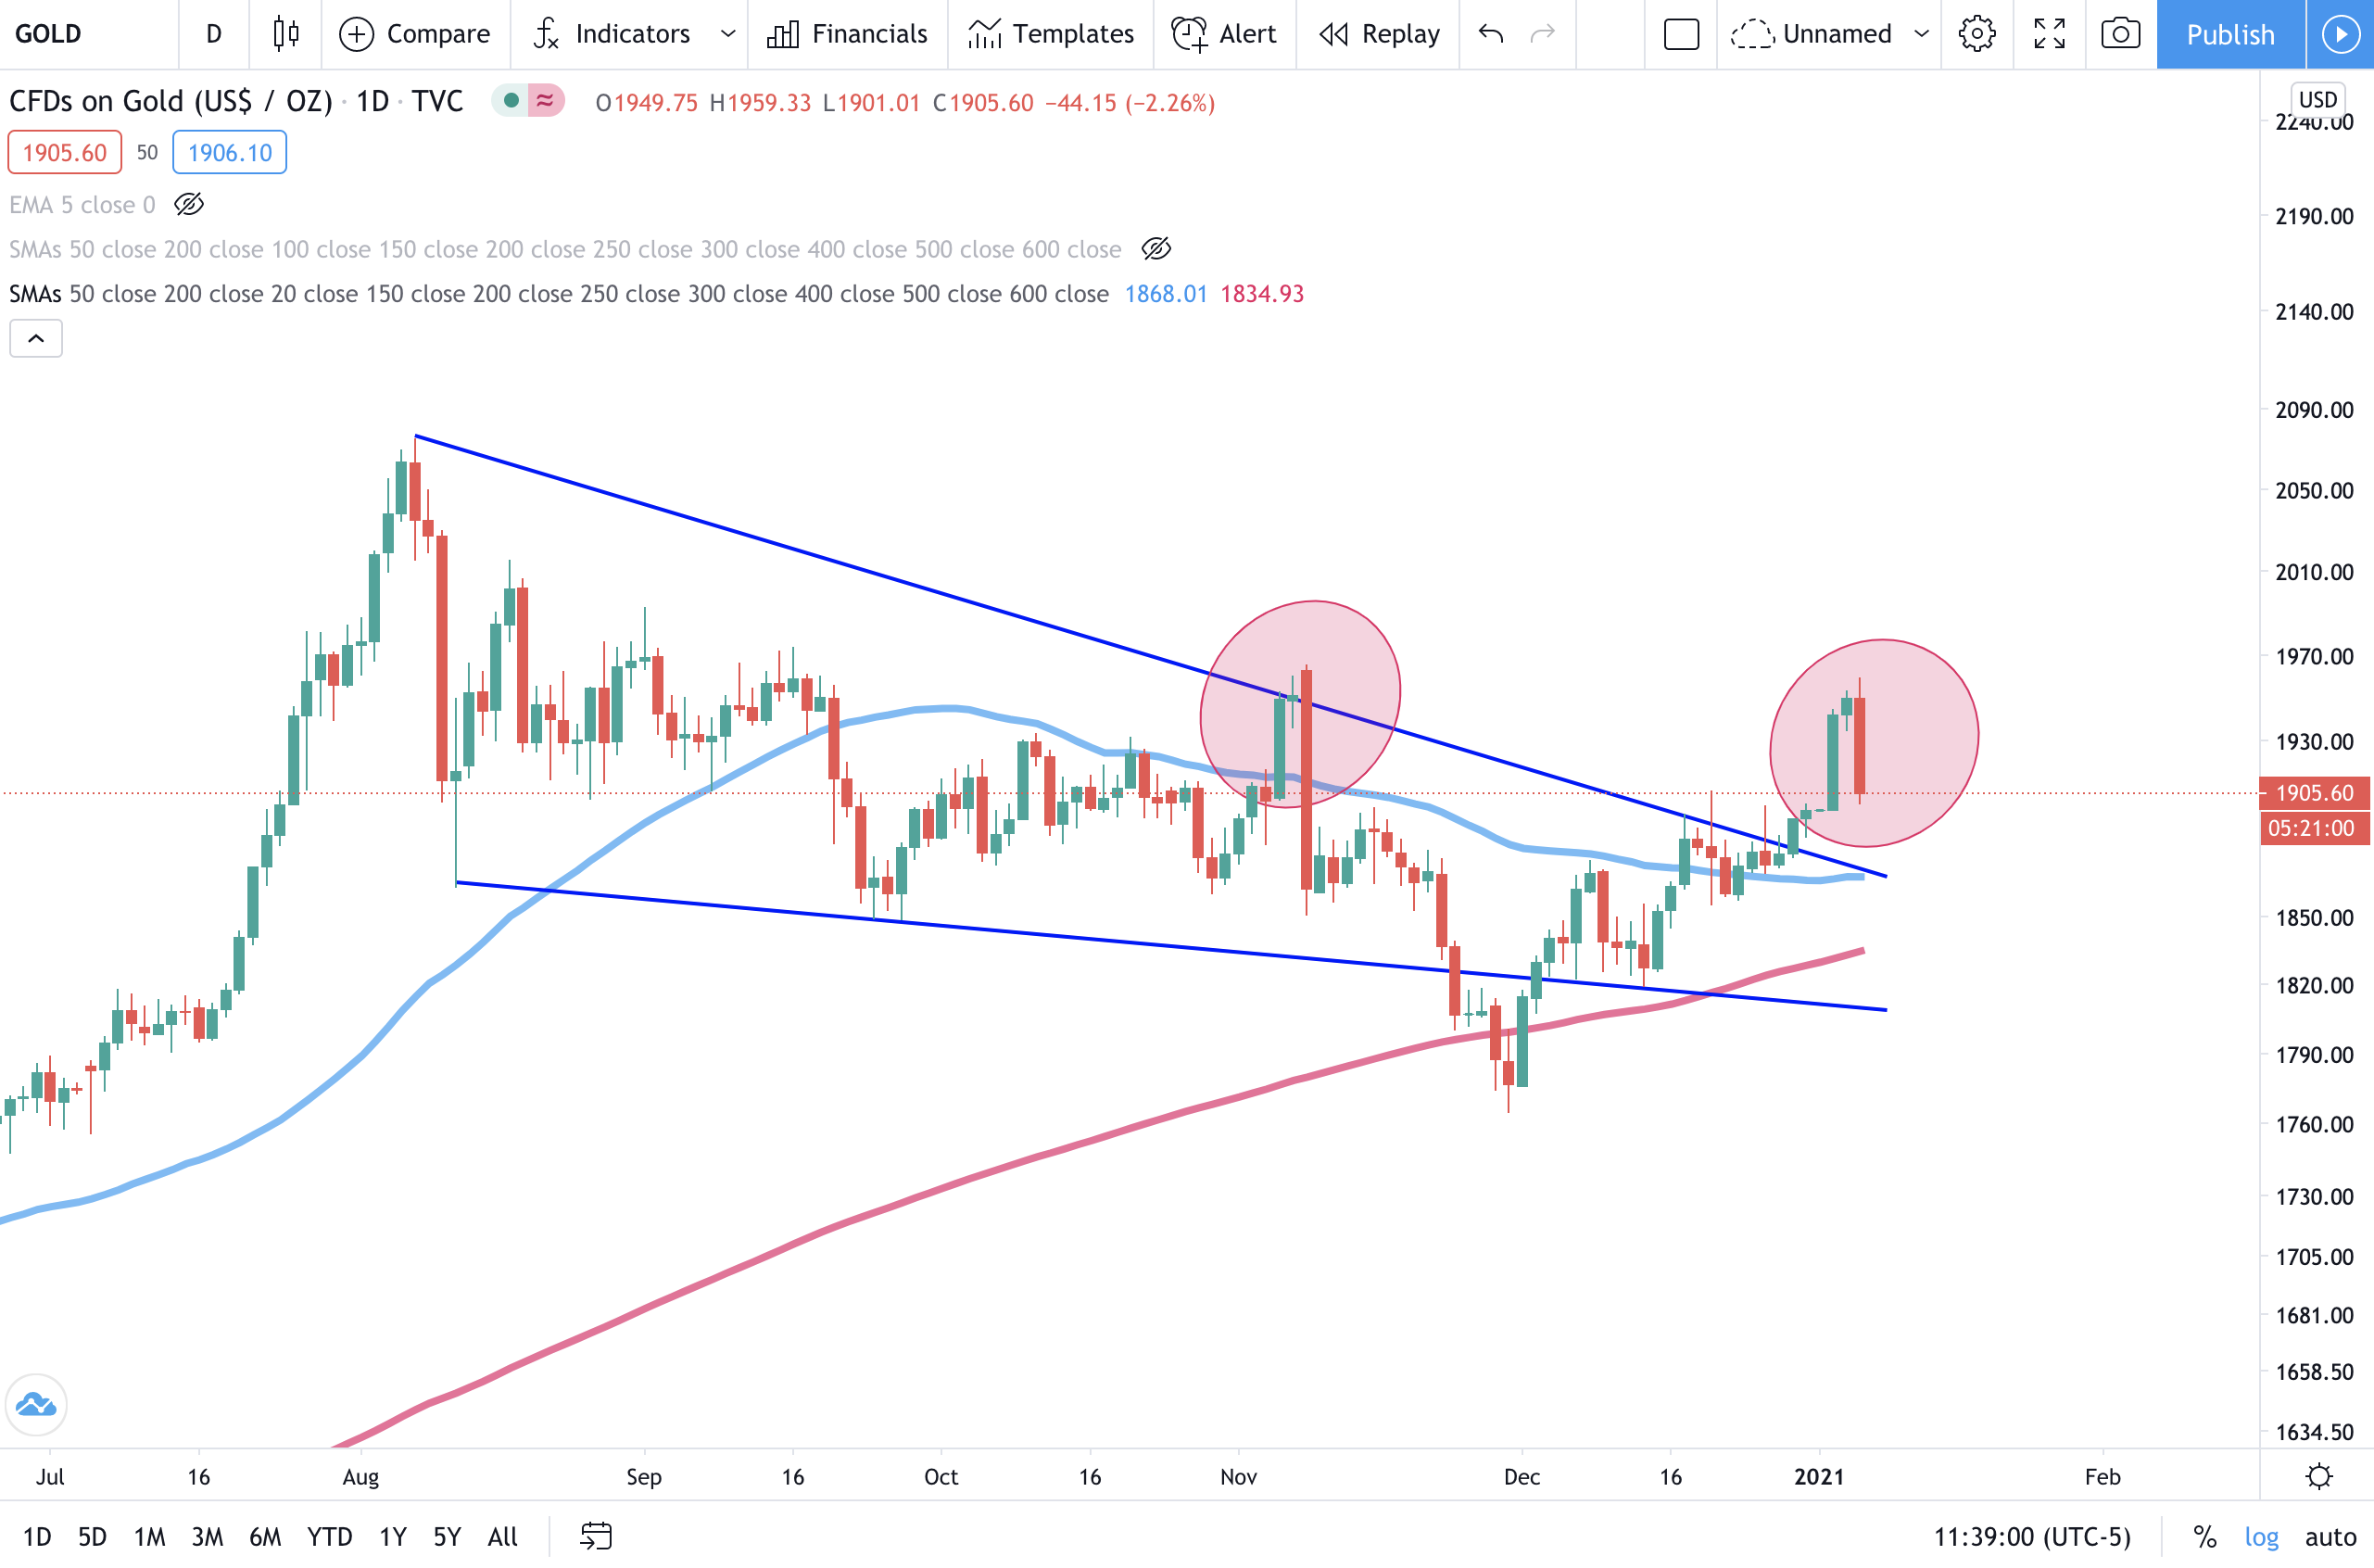
In yesterday’s brief I discussed Lumber and Gold. Lumber as mentioned was breaking down which if that continues can send “ripples effects” into the economy. The unfortunate thing for us is we do not know if this short term trend will trend will continue breaking down.
Gold has been breaking out, but was coming into an area of resistance. Today we are seeing gold fail to make it above that resistance and the price action looks very similar to golds previous pullback.
The markets are throwing themselves all over the place. The very start of the year we began with retesting the December open with a big VOL Spike. Now the Market is showing incredible strength. Today the SPX touched to a new high!
What To Focus On
Let’s look quickly at the weekly candles forming on the indices. As of now (week still has time left in it) the weekly candles are setting themselves up to be hanging man candles.
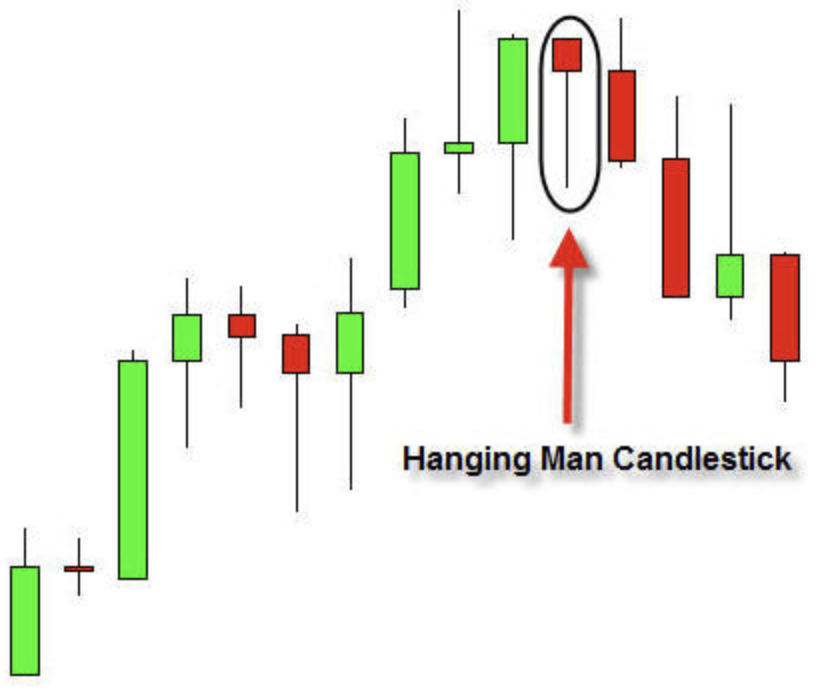
This doesn’t mean anything without confirmation, but it is still important to take note of.
Let’s take a look at the charts to see what I mean…
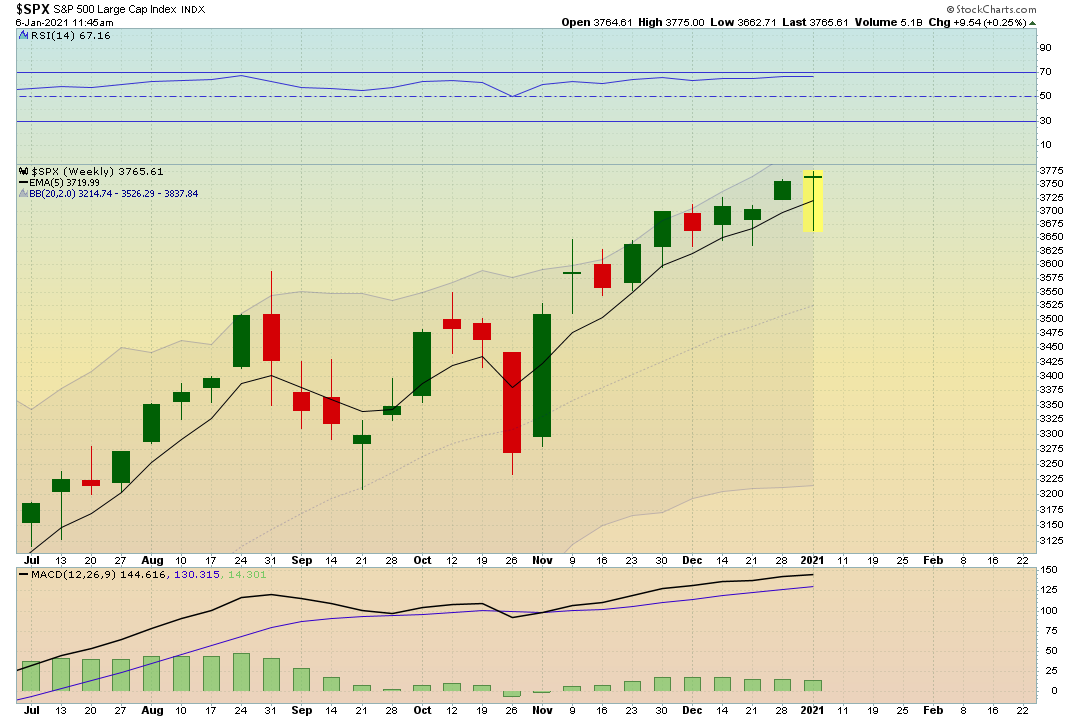
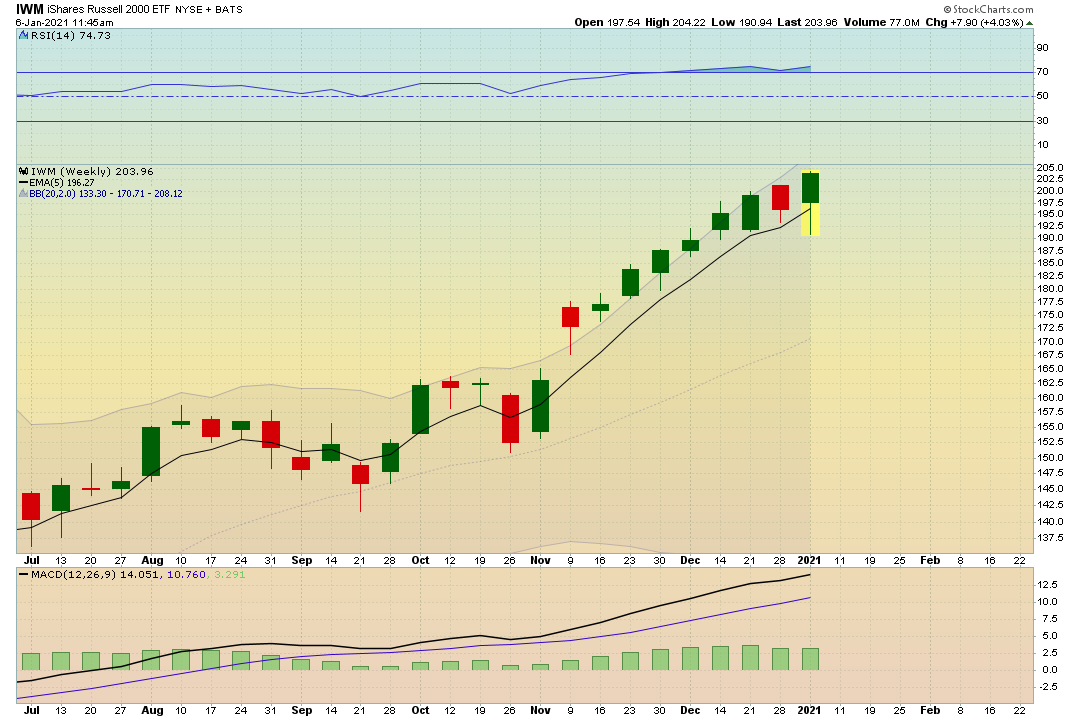
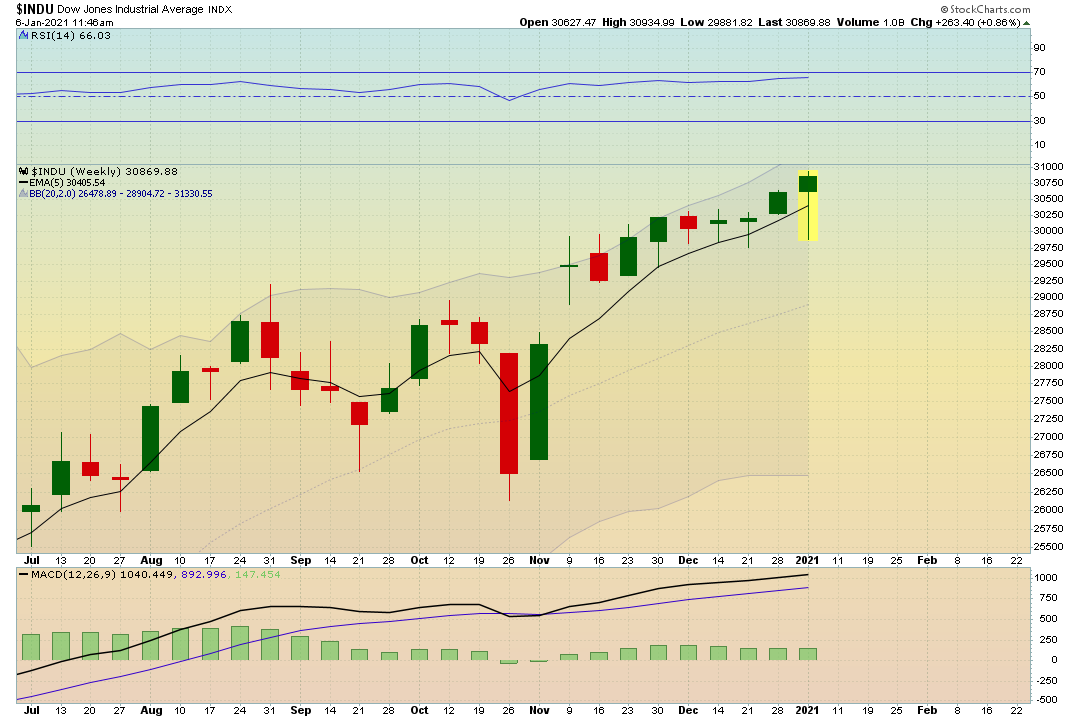
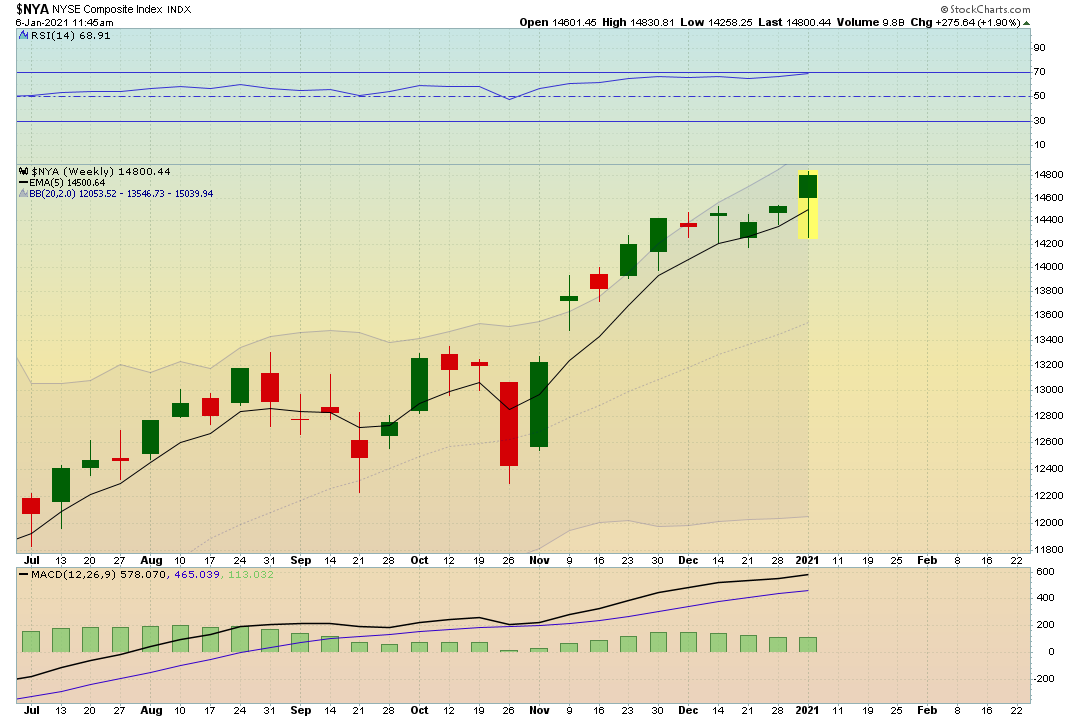
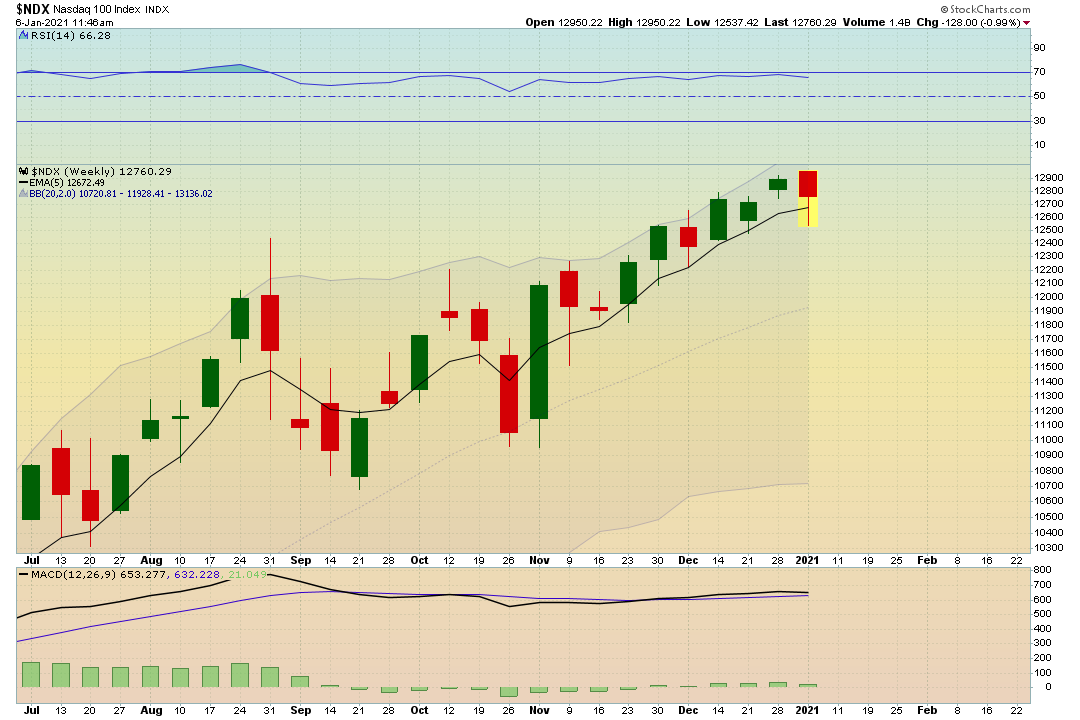
As you can see the are looking very similar from a weekly candle perspective. Once again, this does not mean anything without confirmation!
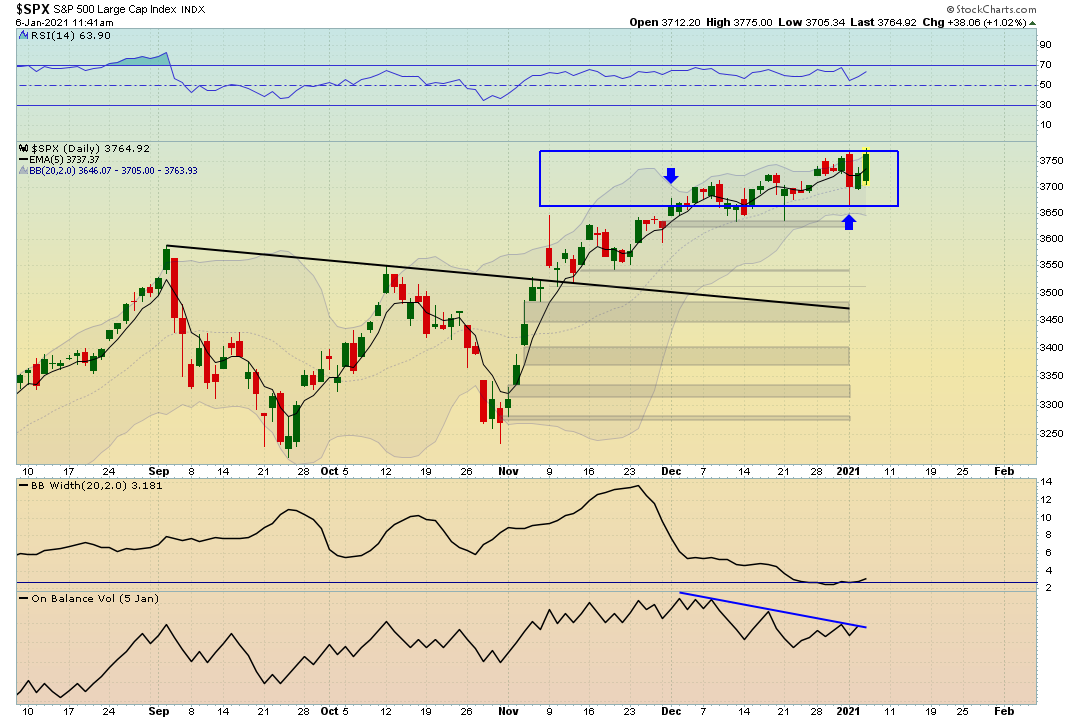
Let’s look at the daily charts now
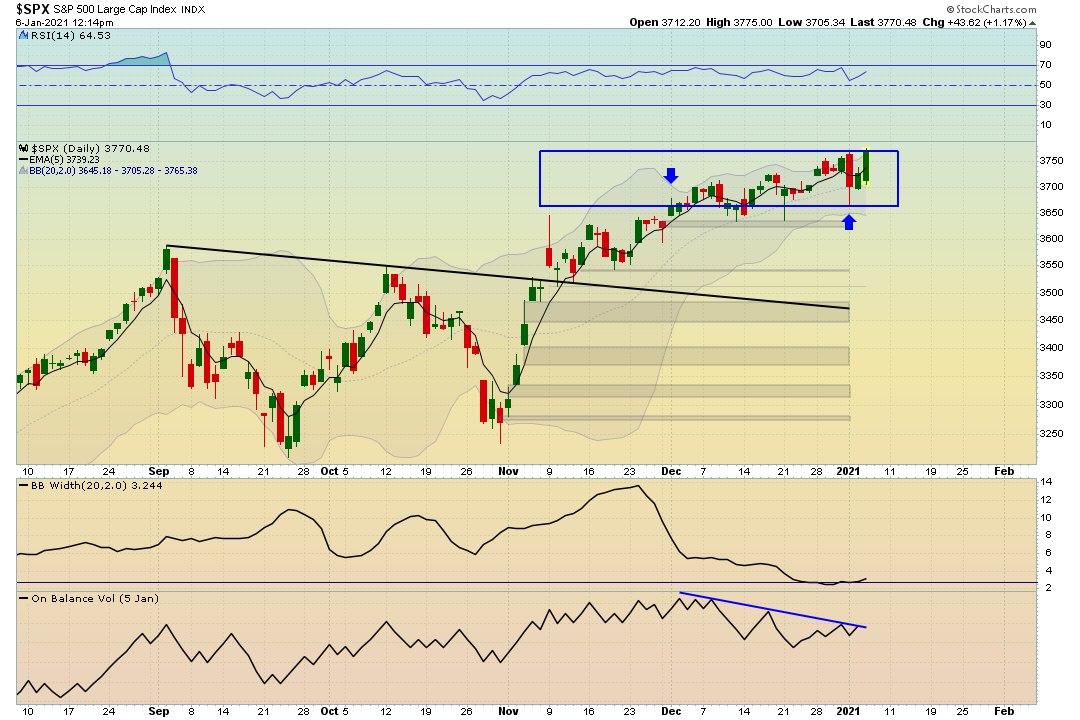
Super bullish day showing extreme signs of strength as it reaches to an all time high.
That is a beastly breakout into all time new highs! Take note of the Bullish MACD crossover.
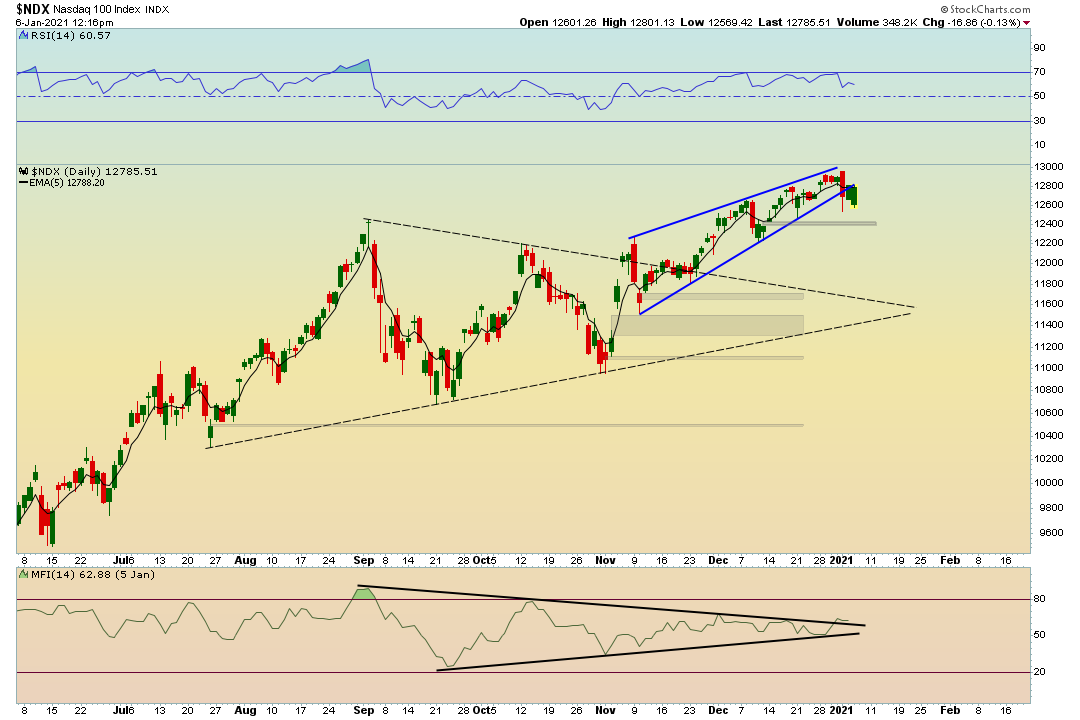
The Nasdaq is trying to claw itself back to all time highs.
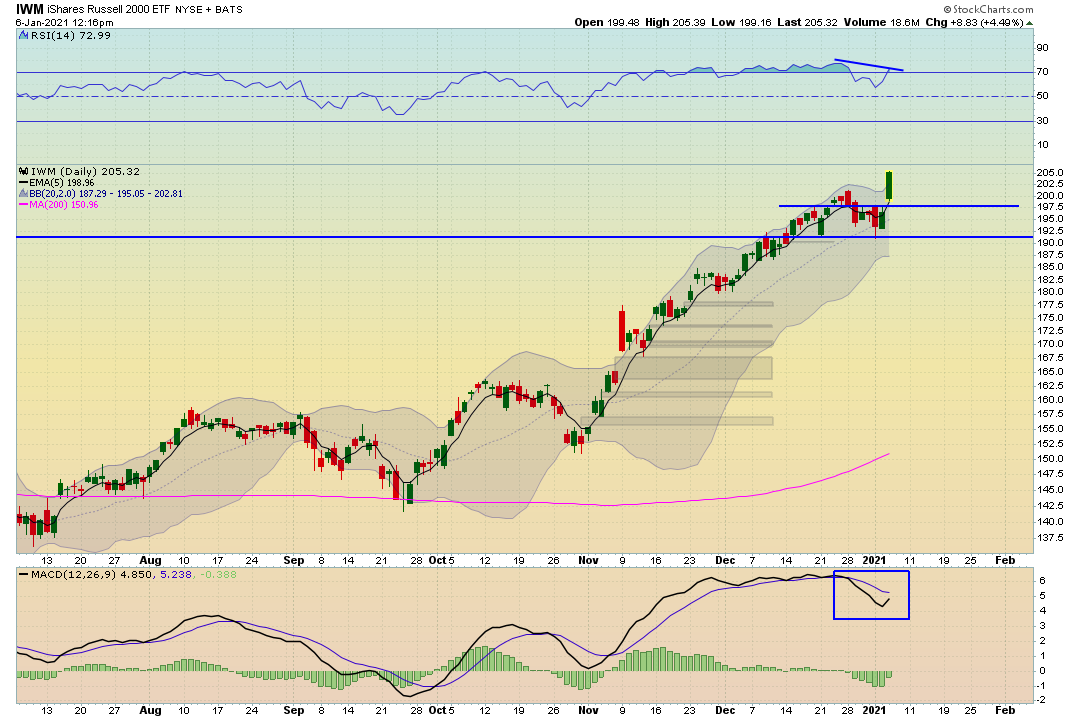
The IWM is getting bid up relentlessly here. The MACD looks like it wants to have a bullish crossover as well.
We are breaking out of an important resistance here. PPO looks to be doing a bullish crossover as well.
FINAL THOUGHTS: The market seems to be breaking very important levels of resistance. When important levels of resistance are broken, it can cause short positions to cover. When short positions cover it creates more buying. We mix that in with the political news, and the other euphoric retail traders we get a buying frenzy! This can cause huge moves to the upside. Perhaps this is a brand new Bull market. Or… Its setting the stage for one of the biggest bull traps in history.
Do not become complacent in these times. This is all new and we are creating history everyday. Whether that history is all time highs in the markets, the fed’s monetary policy, the inequality gap spreading at rapid rates, political uncertainty, or economic uncertainty…. Nobody has a crystal ball. Nobody has 20/20 vision in the market without the benefit of hindsight.
My plan is to continue to focus on risk management. I will play well worth setups with less money in the markets. I do not need to move a lot of capital in these environments because the market is making bigger swings. The bigger swings allow me to use less capital and still capture decent gains. Capital preservation is my most important focus in times of extreme uncertainty.