
11/5/2020 8:52 AM
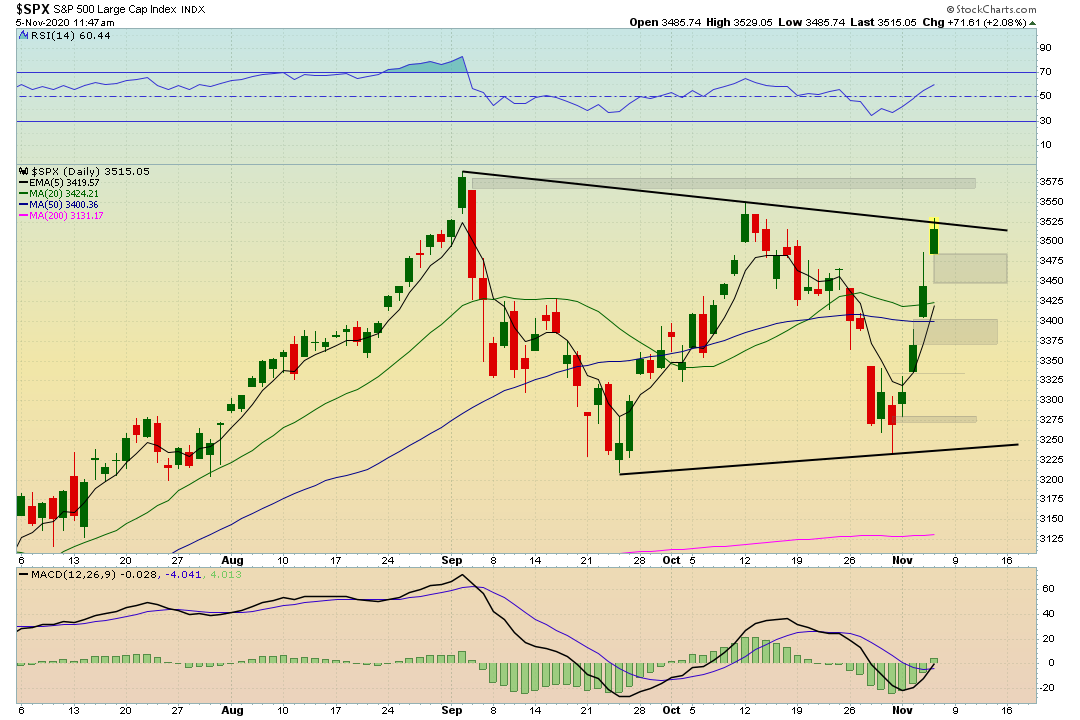
Big move to the upside today, creating yet another gap further extending the price action past the 5 EMA. We did mention there was clearly more room to run. Now the S&P 500 is running into the upper trendline of this symmetrical triangle pattern
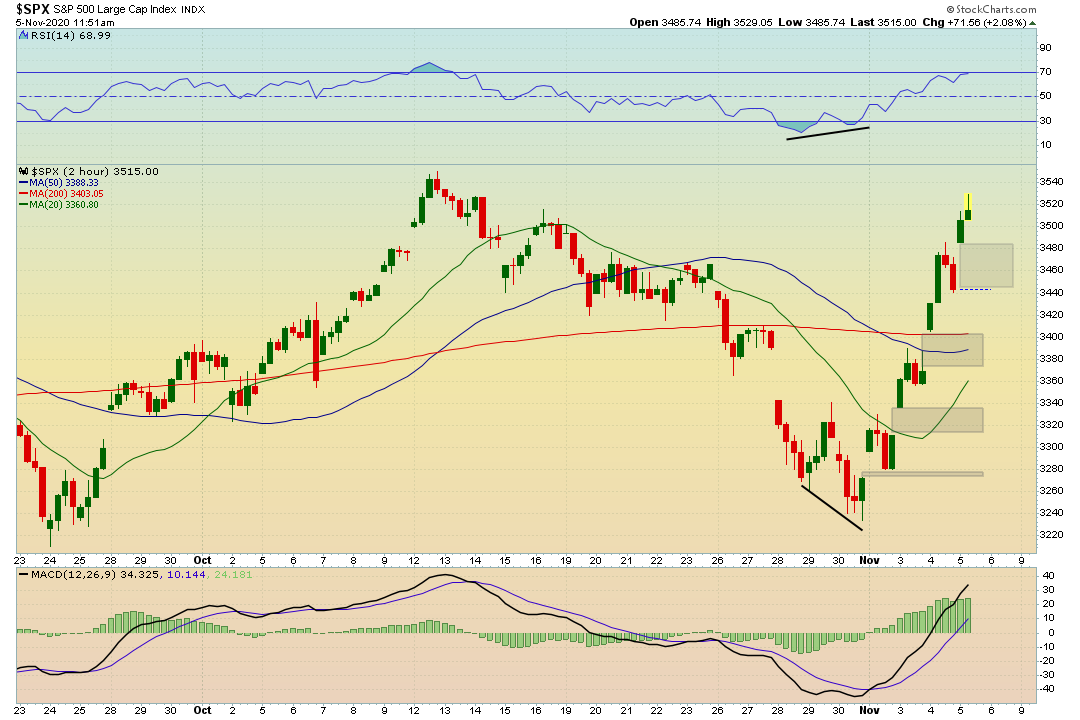
The 2 hour timeframe is moving into overbought territory
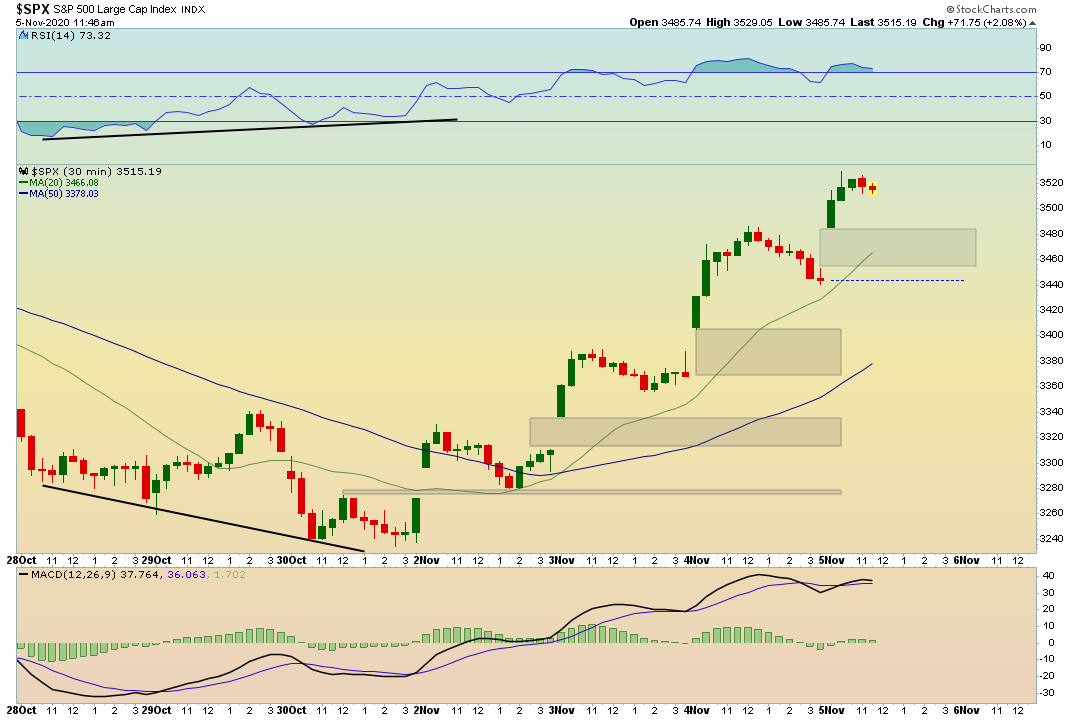
The 30 Minute timeframe is overbought.
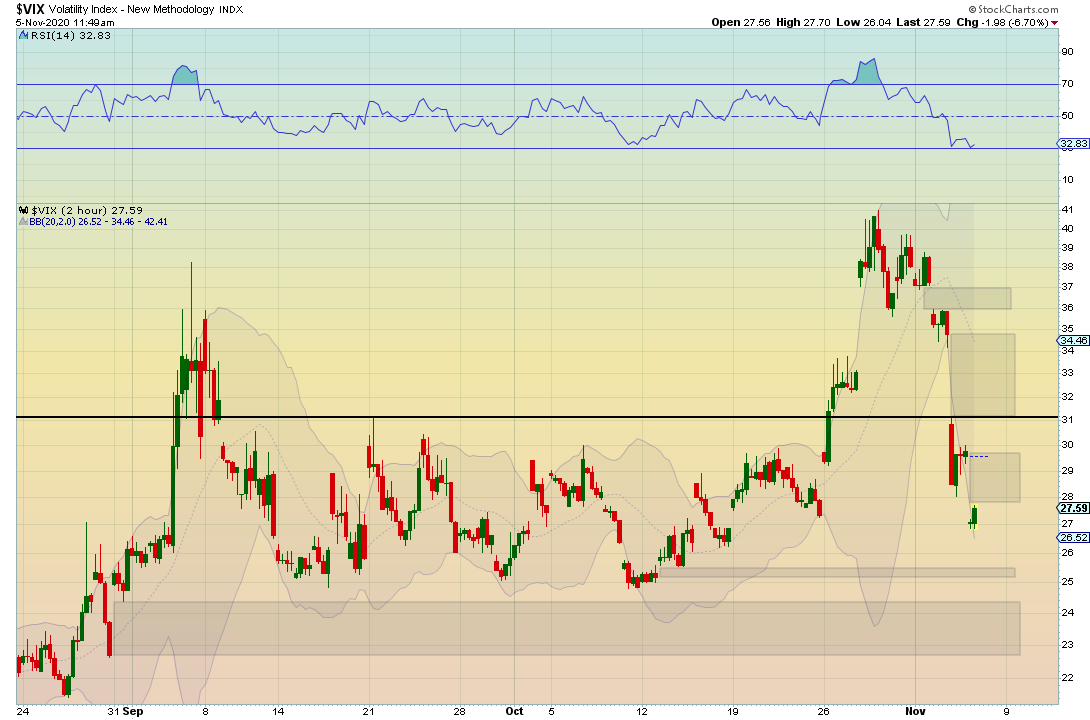
The vix filled one of the gaps below us that we mentioned in the previous Stock Market Brief. Now it a little over extended to the downside.
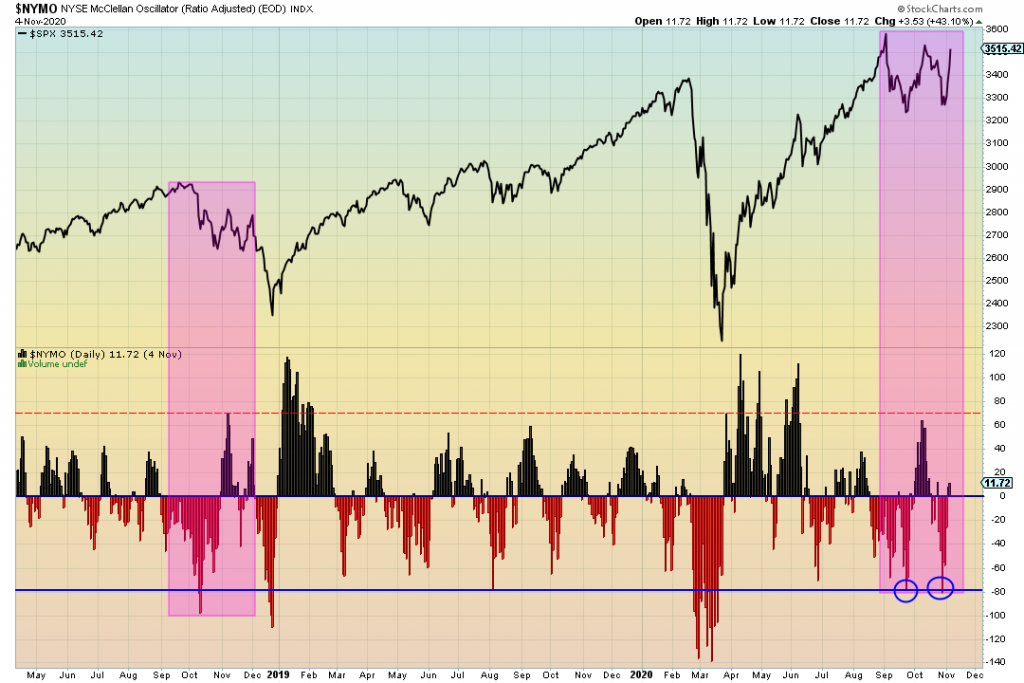
Then more “intermediate ter” to longer term. Our Mcclellan oscillator (NYMO) is still matching the pattern that happened in 2018.