
11/18/2020 10:20 AM
Nothing but a chop fest today as to be suspected. As mentioned on last night’s market brief, there is still the possibility for a run higher into OPEX. My view still stands that this market is overextended to the upside and presents more risk to the longs than the shorts.
However, I am not really interested in shorting this market until we see confirmation, or further extensions I can fade. I plan to hold longer term shorts, but also buy long positions at major areas of support and just scale out of the positions when they move in my favor (or get stopped).
Its a complicated time to be in the markets. Patience is the most valuable asset one can hold right now. I can tell the impatience is building with many people just by reading the various comments in many threads. When hysteria and mania build at these levels and people start believing “the market can only go up”…They tend to get blindsided rather quickly.
Its time to keep calm, stay cool, remain level headed, and make trades that present great risk vs. reward opportunities. They’re out there, you just need to find them, create a plan, and stick to it.
Let’s look at some charts.
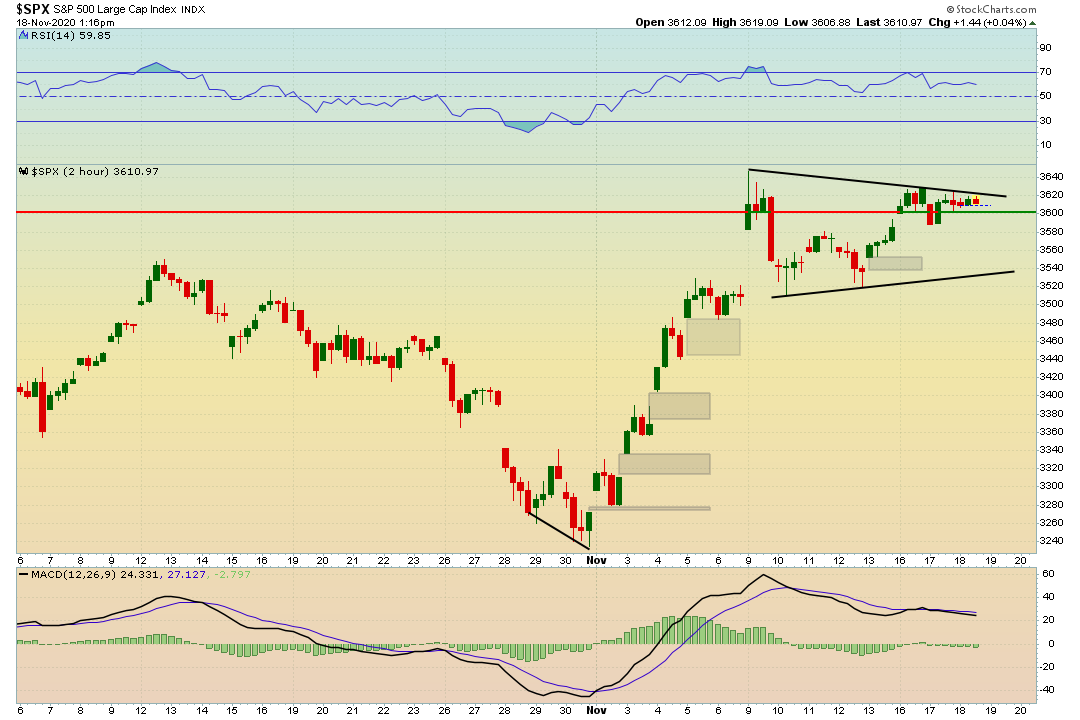
2 hour timeframe of the SPX is in a symmetrical triangle. Building a base sideways might be letting us know that $3600 is holding as support and the bulls want to breakout to make new highs. When it comes to breaking resistance, lately its been done in the after market sessions and we wake up to a gap up. key level to hold on this chart is $3600.
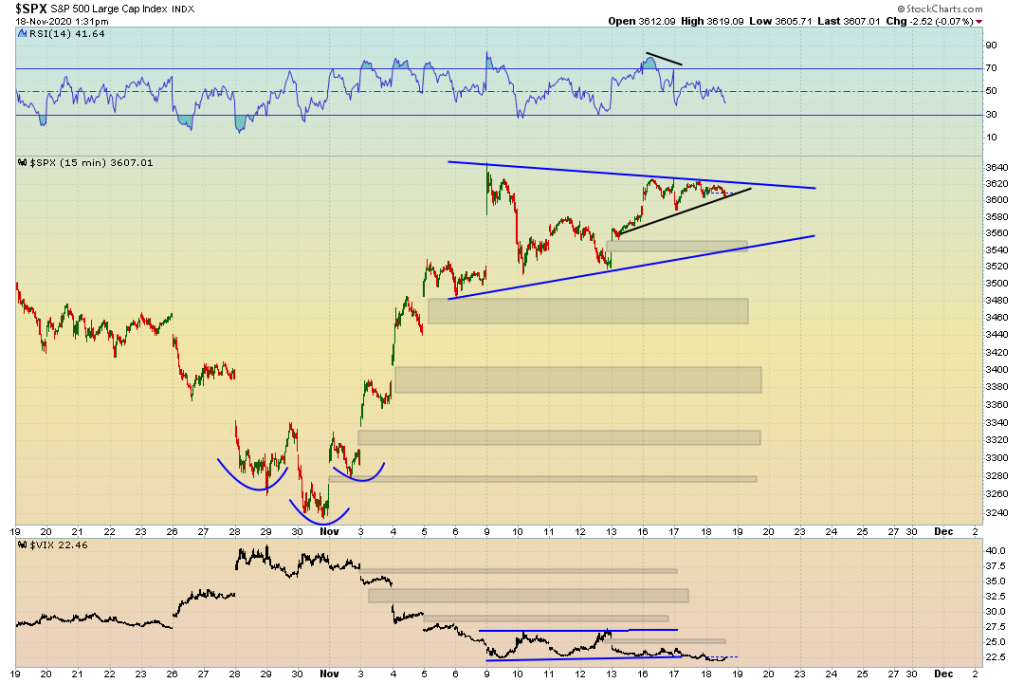
15 minute time frame gives us some more context for the short term. RSI sinking under 50, the VIX is moving sideways and slightly breaking down from the bear flag. I added a black trendline in the middle of the symmetrical triangle that seems to be important to be held by the bulls.
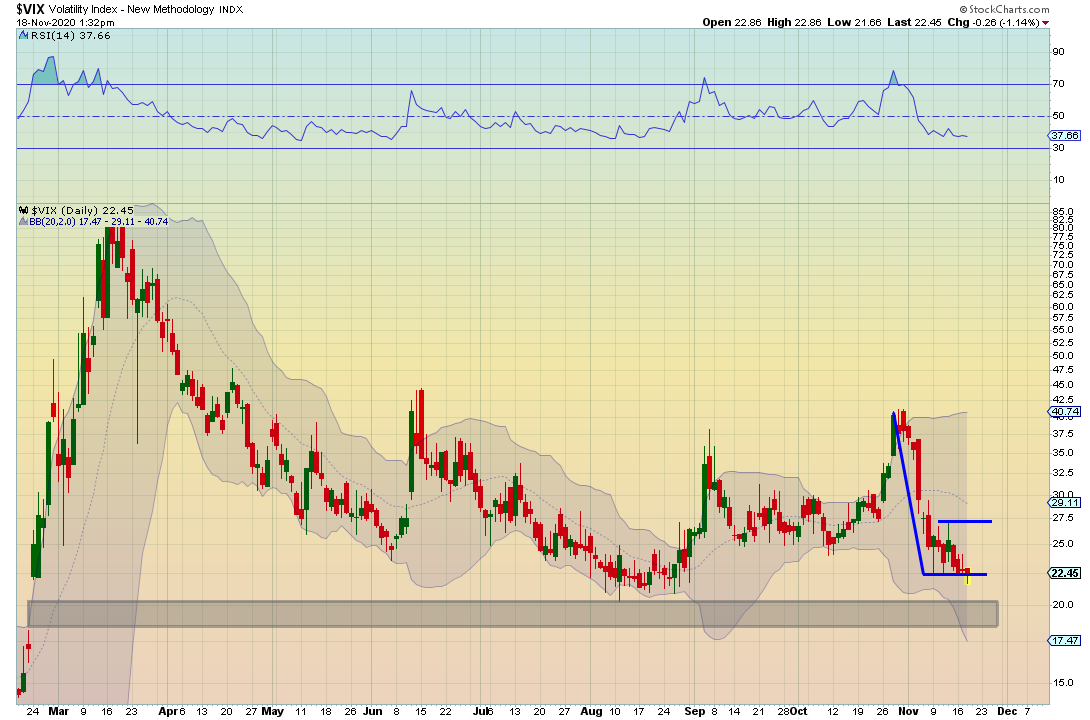
VIX as stated broke out of the lower trend of the bear flag but managed to sneak back inside the channel. Perhaps this is a false breakdown?
Bulls need to keep control of the 5 EMA here. Price action is struggling to get back above and stay above the symmetrical triangles upper trendline.
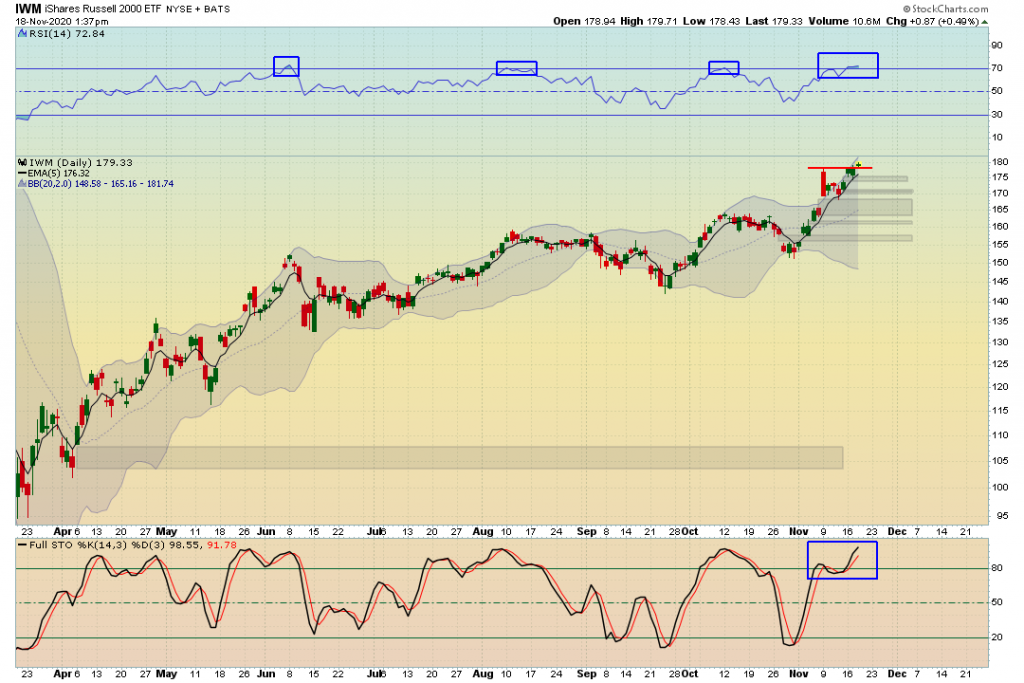
All time highs again for the small caps. This one boggles my mind the most given the current standing of the economy. But let’s just stick to the chart… Price action is moving into upper Bollinger Bands, Stochastics is signaling overbought, & RSI is signaling overbought. Typically the RSI on this chart doesn’t hold those levels for long before getting a pull back.
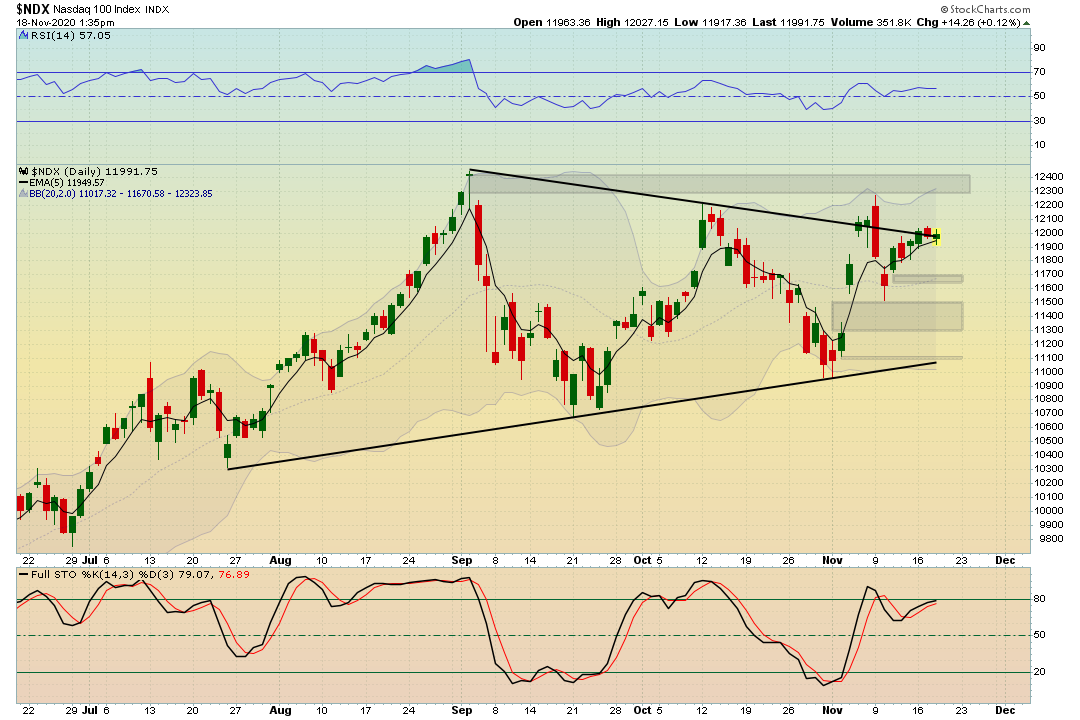
I can go on and on but will cut it off here. The Market is overbought, however there is still some room in the indicators to move us higher. This looks and feels unusual (because it is). From a technical standpoint, this market is due for a correction. The last thing on my mind is going long right here. The first thing on my mind is looking to go long at major areas of support.