

11/19/2020 11:30 AM
Want to get a quick update out on some 15 minute time frames. I discussed this on yesterday’s market brief and want to provide the possibility of a new pattern that can potentially form.
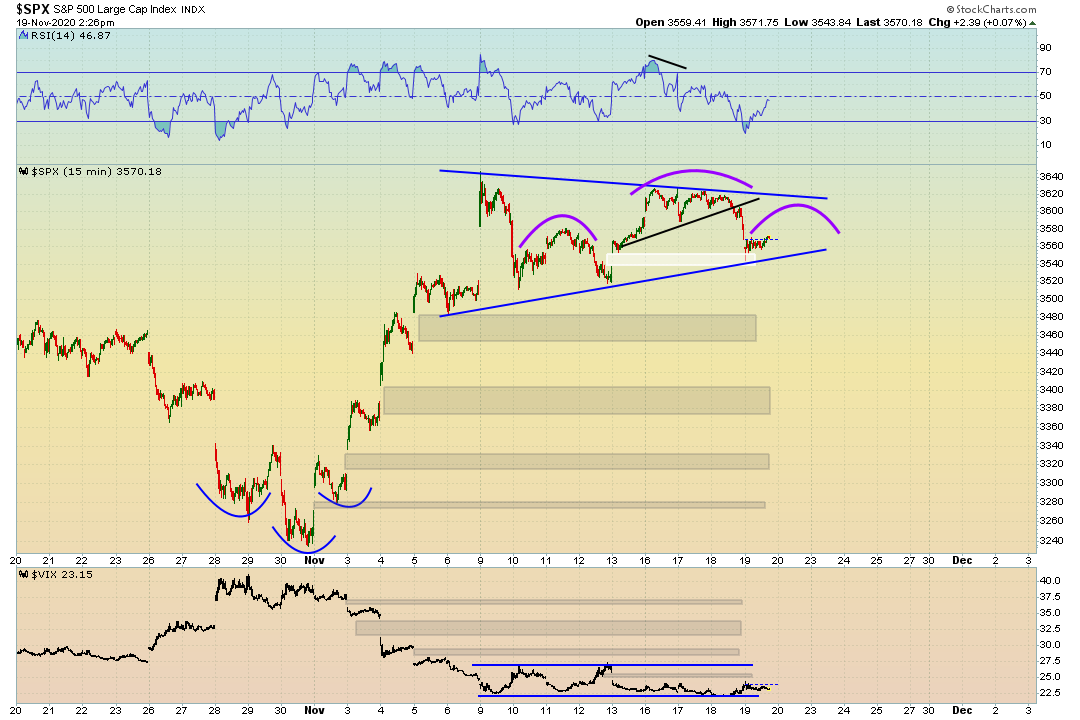
The S&P 500 came down to the perfect target (lower trend line, and gap). We are seeing a minor bounce from those levels. This to me made a lot of sense because of the RSI being in oversold territory. I want to show the possibility of a Head and Shoulders Pattern forming within this symmetrical triangle. The neckline would be the lower trend line of the triangle, or one can argue its $3520- $3550 range.
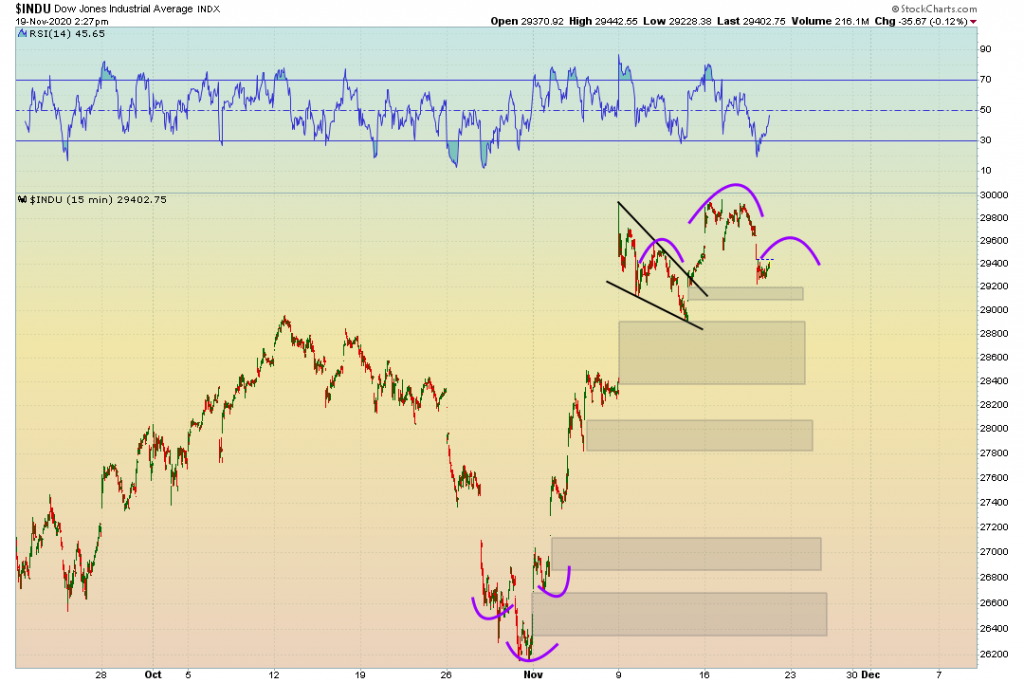
The dow looks very similar here. RSI was oversold, we are seeing a bounce take place. Perhaps this is a head and shoulders pattern forming.
My thoughts: Its OPEX week and things can get pretty choppy (As we are seeing now). For now, I am just standing on the sidelines and staying patient. I want to see if this selling action continues, or if we will breakout to the upside of the symmetrical Triangle on the S&P 500.