10/12/2021 Daily Update
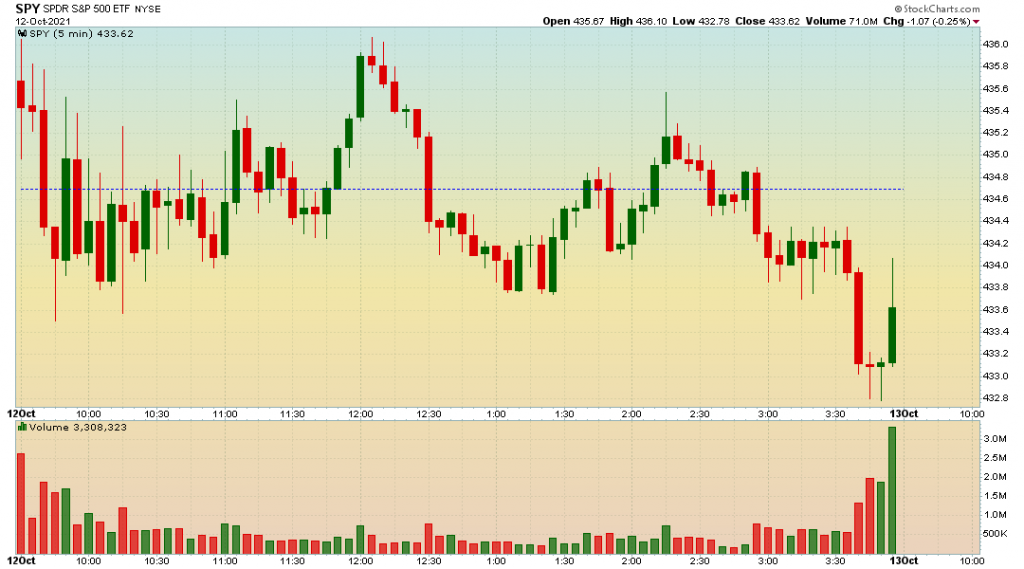
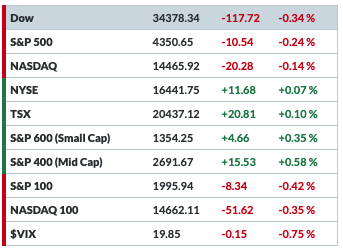
Hi everyone! CPI data comes out tomorrow. If it is much higher than expected, well it can put pressure on the markets. If it comes in as expected or lower than expected, I would imagine to see some relief. Today’s price action once again was all over the place in anticipation of this data. Both the SP500 was down and the VIX
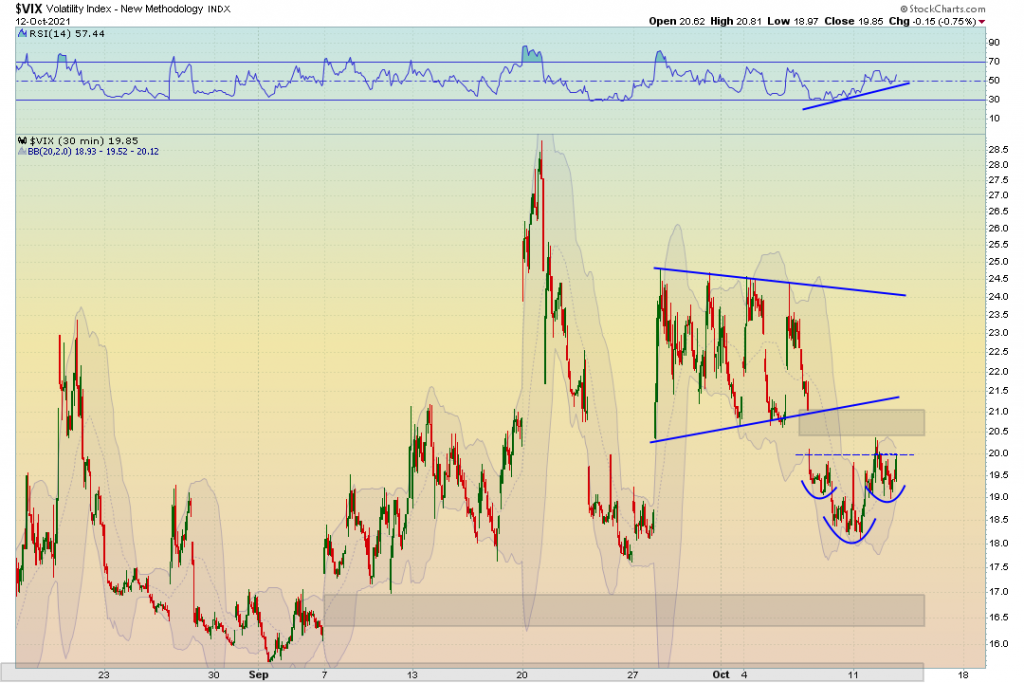
The VIX still has a gap directly above us (and even higher around 40 not displayed on this chart). There is the potential for a little inverse H&S that can pop the VIX to around 22 for a full measured move.
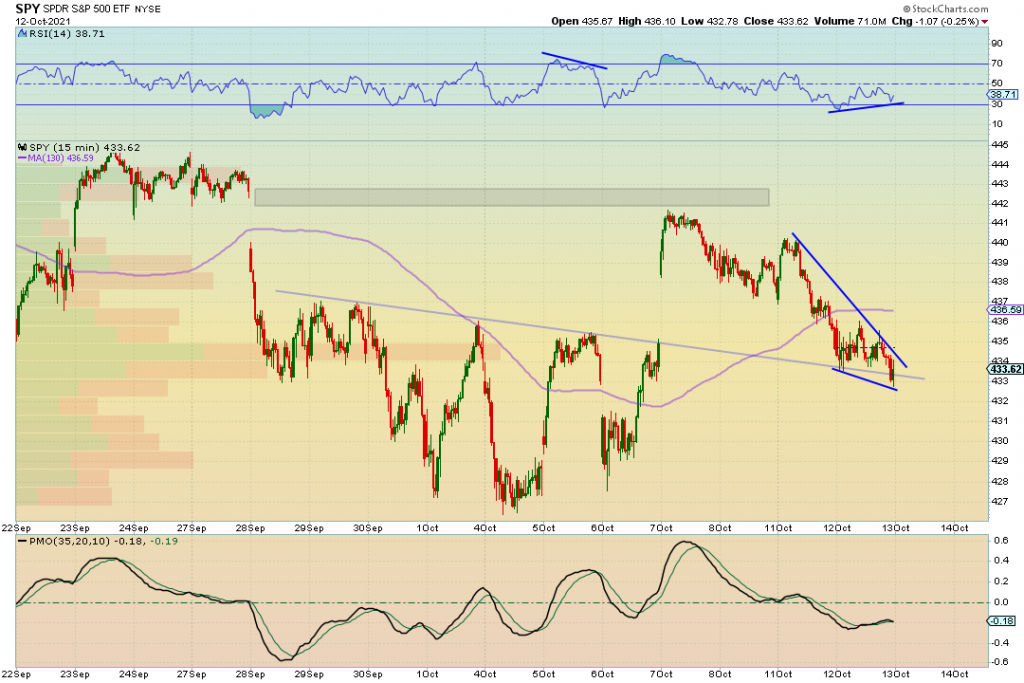
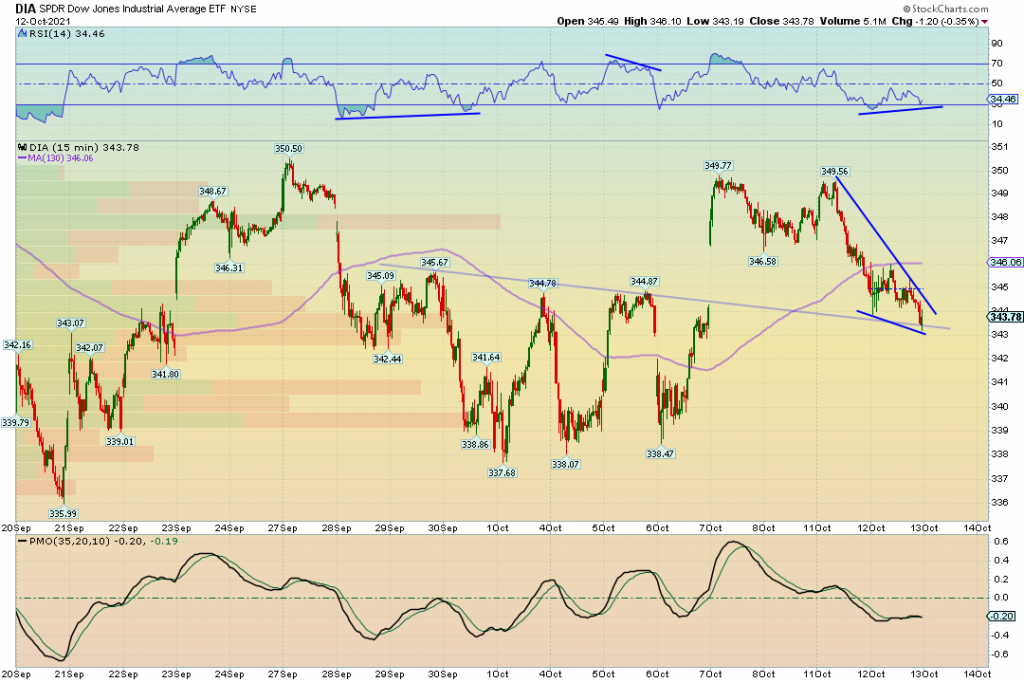
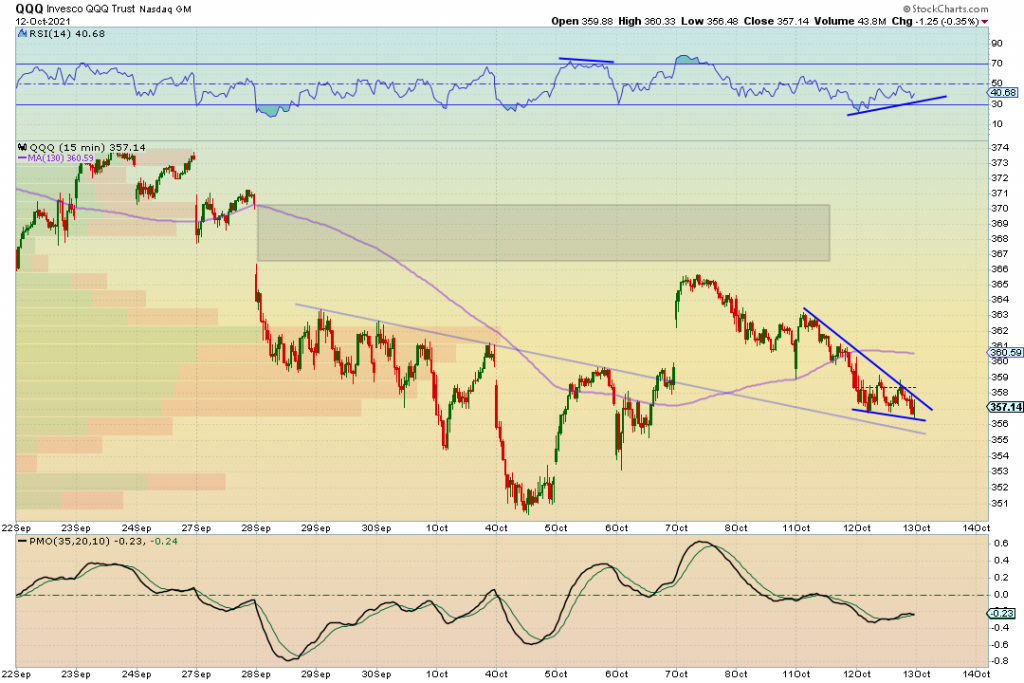
Take a look at the 15 minute charts. We are seeing lots of positive divergences and wedges forming.
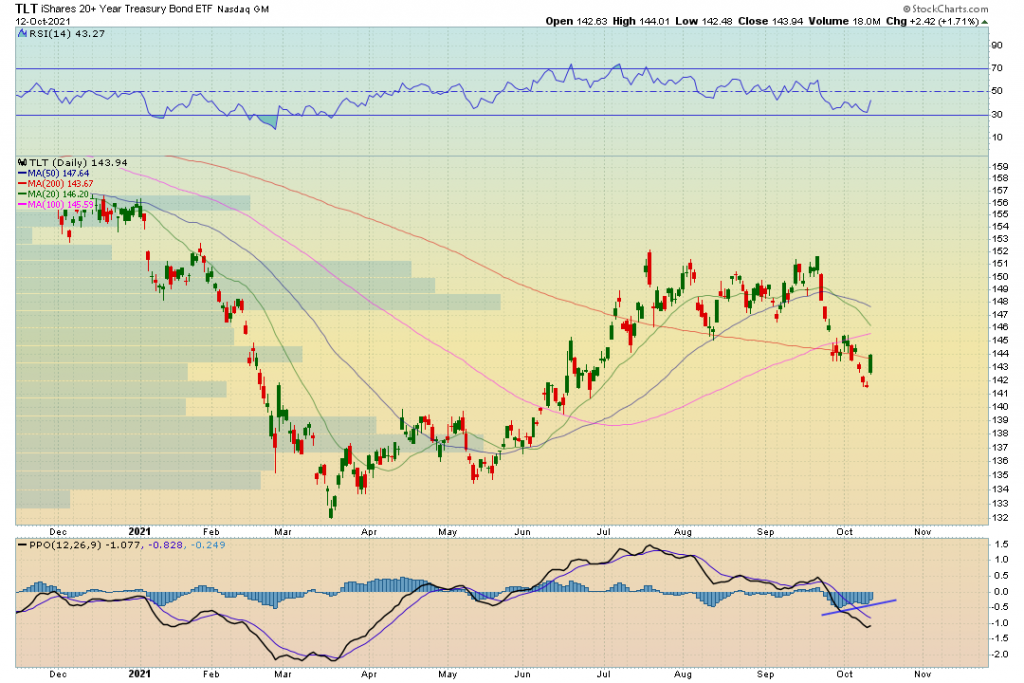
Bonds started to run, Yields came down slightly and that can be positive for big tech
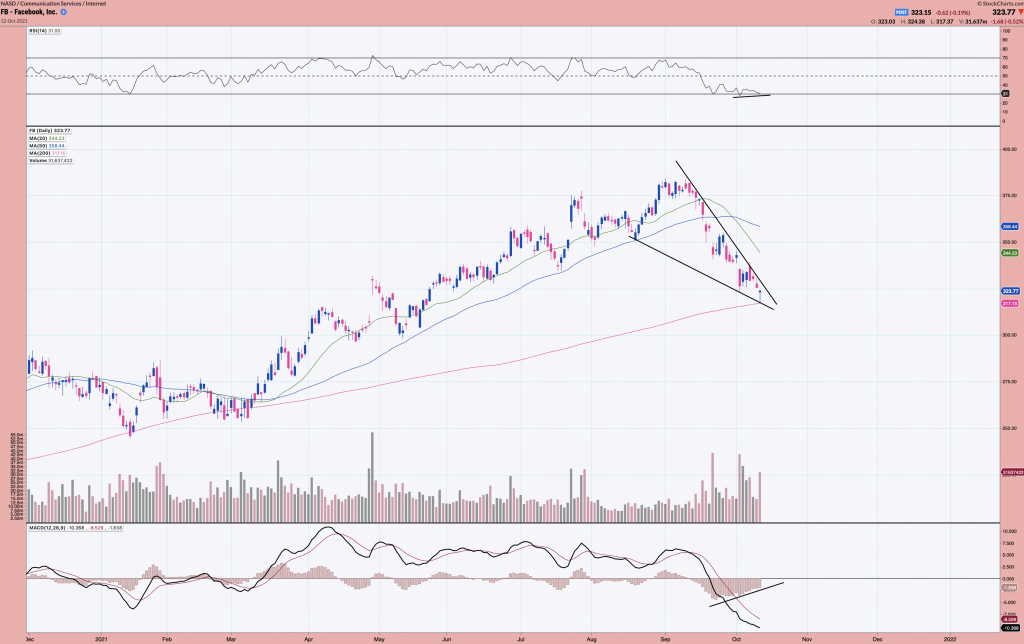
Speaking of big tech, FB had tagged its 200 day moving average today. Price put in a positive divergence in the RSI and MACD histogram & looks like it way want to bounce.
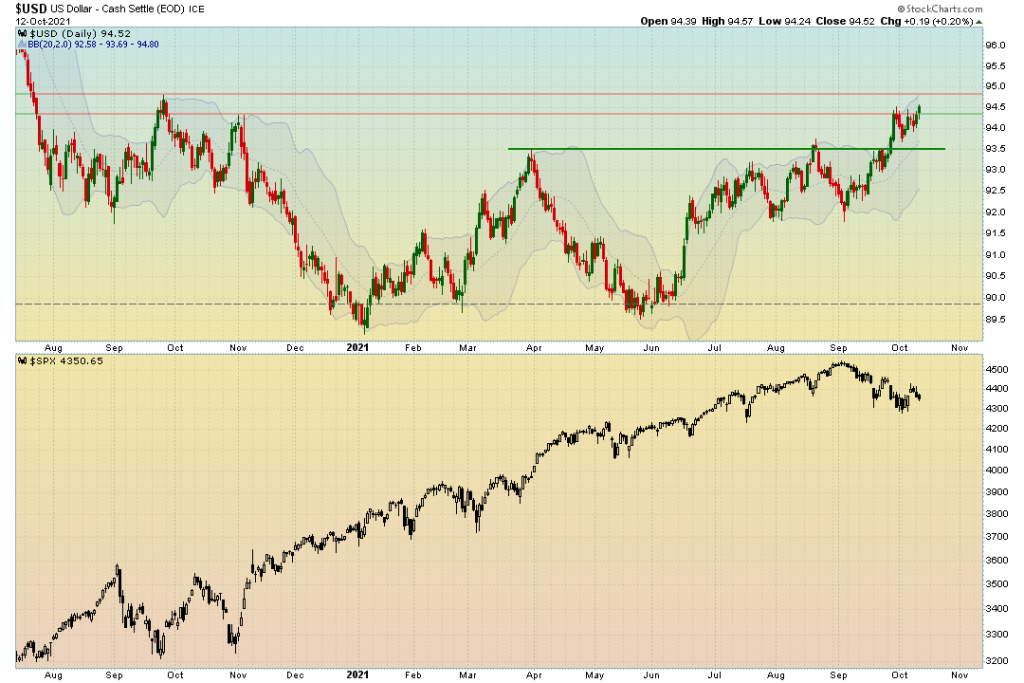
The Dollar continues to hold strong which continues to put pressure on equities.
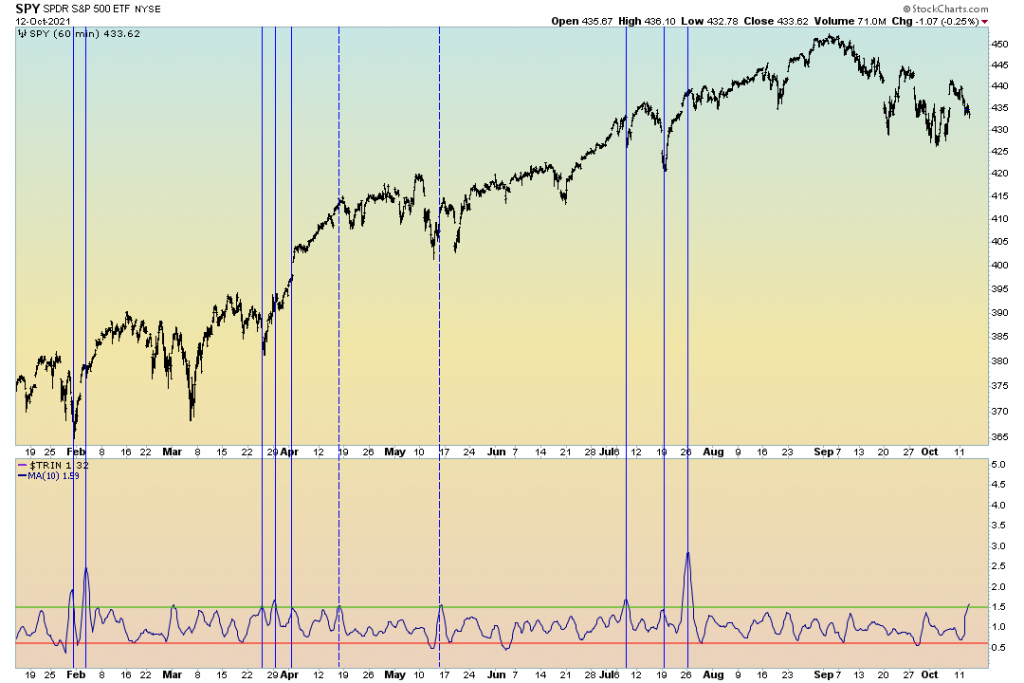
The TRIN indicator I use just crossed above the green line. 8/10 last times that happened the market shortly after went higher. When the indicator crosses down through the red line, the market tends to get weaker. This is not a perfect indicator, but the data can be useful.
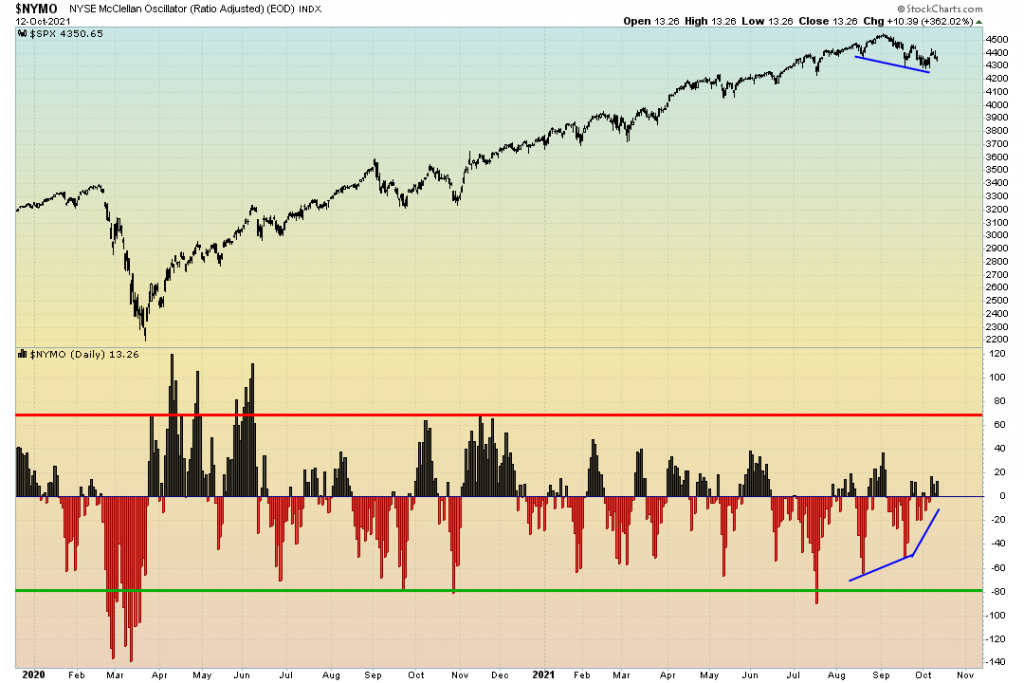
The NYSE McClellan Oscillator continues to show positive breadth despite the market weakness.
CONCLUSION: There is some bullish price action setting up on the 15 min charts. The market however remains in a short term downtrend and that should continue to be respected until we can put in a higher high and higher low. Buy the Dippers have been getting hammered if they are not being tactical in this environment. The safety trade is gaining strength as evidenced in the Dollar and Bond. The VIX has a short term bullish setup, but as stated earlier that can be wiped away with CPI data coming in lower than expected. Big Banks Report on earnings coming up, FOMC minutes, CPI, Consumer sentiment, etc. There is many reasons to just sit back and watch how this plays out before moving heavy into any one position. There will always be opportunities, just need to be patient. Careful out there!
For “TRADE IDEAS” I started a Patreon & charge only $9/Month. All trade ideas are posted in the Discord group. Thanks for supporting the channel: https://www.patreon.com/figuringoutmoney
6/20/2021 Weekly Recap
Hello Everyone! This week was very busy for so I am unable to create a weekly recap video. I interviewed Michael Gayed (almost done editing), also filmed a Gold video that just went live today. I wanted to get on here and share a couple charts and thoughts heading into next week.
First, I want to start this off that last week was a very difficult week to navigate. With the FOMC meeting and OPEX the markets were all over the place. As stated in my last market brief we really need to see how next week unfolds to get a good idea if this is really heading into a bigger move to the downside.
Let’s look at some important charts.
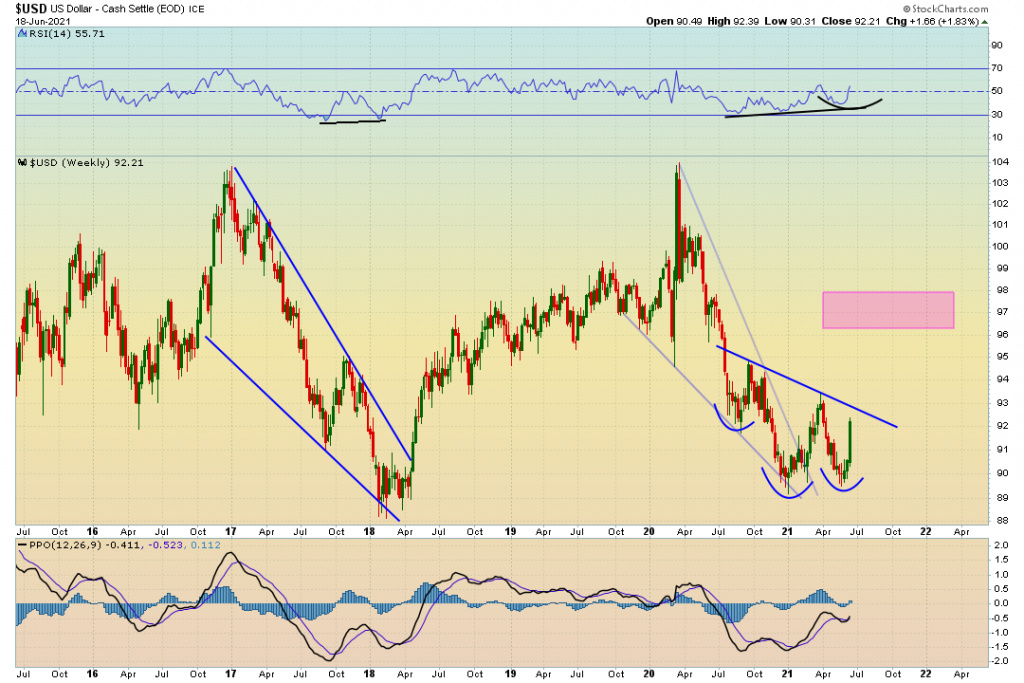
The Dollar on the weekly time frame is showing some real strength here. There are various indicators that suggest this move can continue. From a technical perspective this is a inverse H&S pattern. If it recaptures 93.50, This can suggest more risk off is coming.
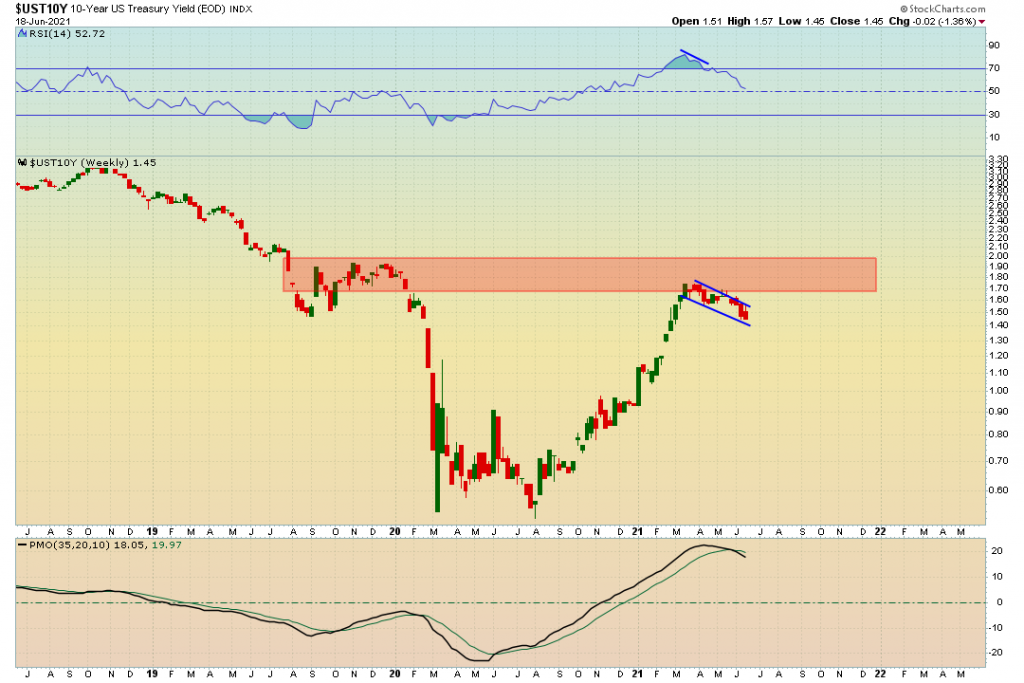
The 10 year yield was the most interesting chart during last week. Long term yields headed lower and short term rates spiked. This created a flattening of the yield curve which is not good for financial stocks. A concern to me is that the PMO just had a bearish sell signal (still above 0 though) This can suggest more weakness ahead for the 10 year yield.
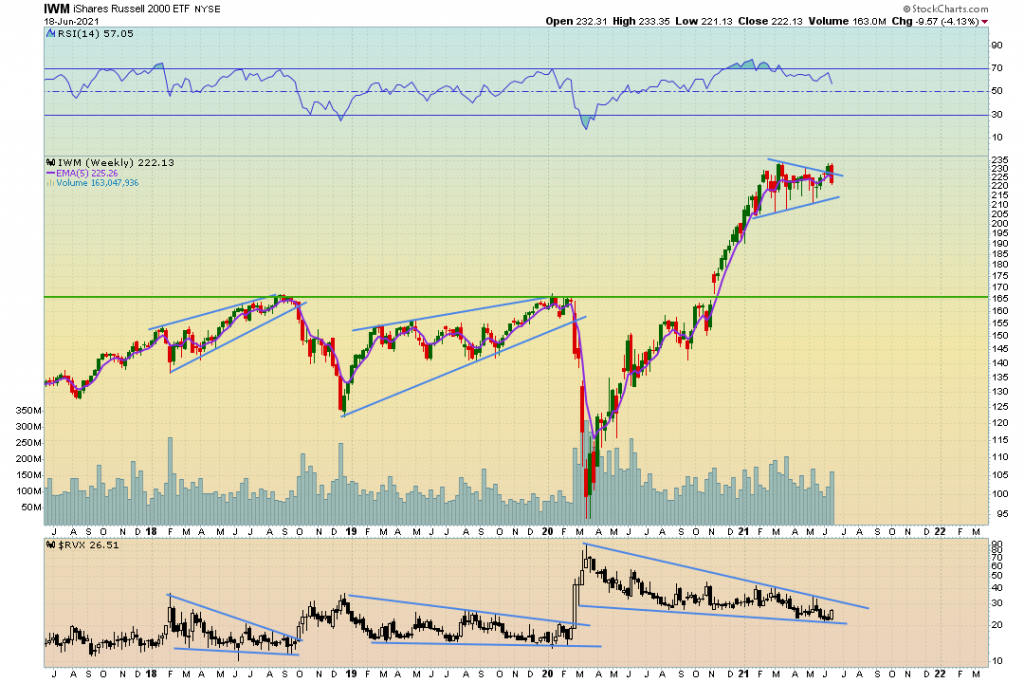
With financials heading lower & lumber, this really put the pressure on small caps. IWM was down 4.13% for the week after a false breakout. The price is still in a consolidation phase so no real structural damage here. However, this chart isn’t where i would want my money if more risk is coming.
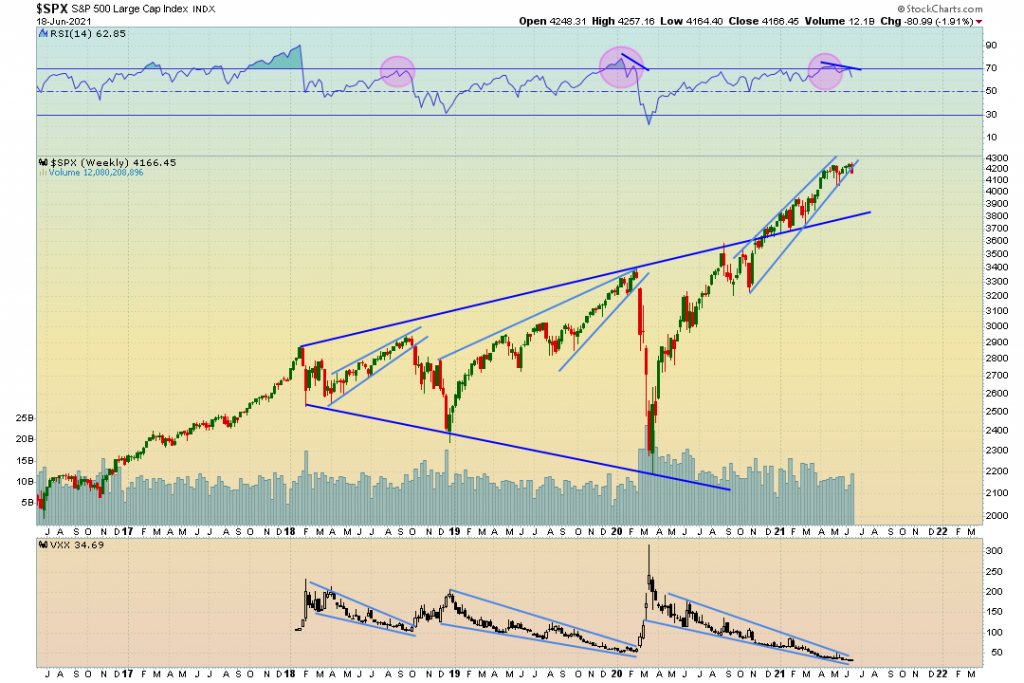
The SP500 was down almost 2% and is still not far from its all time highs. We did have a trend break. This is very important to watch going forward. The bears have a strong chance to gain some more control here.
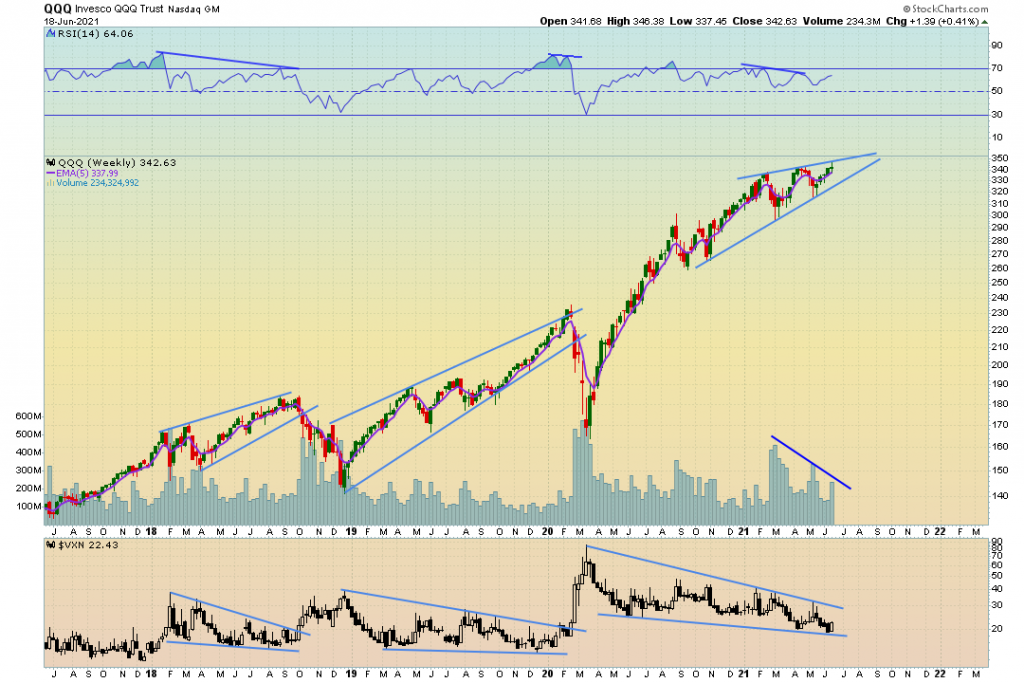
Big tech stocks held up. The QQQ’s finished up for the week. this makes sense when the 10yr yield was falling. We have seen the opposite happen when the 10yr rises. This could be a bearish pattern forming after a solid run up. If we do see more risk enter the market, Tech stocks from a relative standpoint look like they are positioned to outperform value. *From a relative bases*
Let’s look at a couple signal charts.

The sell signal chart is heading north but has not crossed through .8 yet.

The NYMO is getting oversold. This is the fear I was looking for to see a rally into July. This can go lower however, it typically finds its feet around these levels.

The NYMOT is also getting to oversold conditions. The trend break in the NYSE is something we really need to focus on next week. The reading can go lower here as well, but it’s likely to see stocks get some traction at these levels.

Banks are down 10% month to date and this is fear indeed. We reconnected with the monthly 5 EMA and previous resistance. This makes sense to see it act as a pivot area. However, we call that red line the “Red Zone”. Why well because look at the dates its been there before. Financial crisis, repo, pandemic, and now we went vertically through it without a correction.

The last chart I will share is the BPSPX. We are in oversold conditions on the RSI, however the reading on the chart (64.80) is still relatively high. Oversold conditions can remain oversold for long periods of time.
CONCLUSION: The signal charts are getting oversold. The readings on them though are interesting. Its showing lots of fear and panic with little to know damage. Its almost as if this is just all a knee jerk reaction and we can see that rally into late June and early July. There are trend breaks on many of the indices and some failed breakouts as well. Last week was very complicated to navigate. This coming week I assume will be the same. There are charts that suggest that Big tech growth is a safe place to be. However, Value got destroyed last week and it seemed like panic selling. Typically when there is panic like this and lots of fear you can see continued selling into next week but also presents opportunities to buy on strength. Everyone is talking about rotation into tech while it sits at all time highs, my eyes will be watching value stocks that got hit the hardest. Personally I am heavy in cash at the moment. Why? Well because if the economy is going to go in a spiral and all the divergences and risk off indicators we have been talking about are truly going to come to fruition, cash seems like a safe place to be as well as bonds (as they have been bottoming and now catching a bid).
Be safe out there. See you next week.
2/8/2021 6:30 AM
It looks like we are going to start this monday morning with a gap up.

If you haven’t seen my recent stock watchlist on youtube, here it it. I went over 13 different stock setups and walked through how I would go about trading them.
The script that seems to be playing out right now is what I talked about in this youtube video. The Dow Jones, and various other indices were forming a declining broadening wedge pattern and up until recently broke out of the pattern and started heading higher,
I am starting to receive more comments saying that I am more bullish than ever haha. A simple tip when it comes to markets is just dont bother trying to assume what anyone else is thinking. Watch the price action. We had mentioned that when the S&P 500 reached its 50 day moving average it would be time to look for individual stocks to go long with.
The market is still at incredible levels, and is not structurally sound. If anyone thinks this is a “normal market”…Think again. This is very similar to february of 2020. Which means a rug pull can come at any moment.
If a rug pull is in the deck of cards, we must be ready at all times for when that card hits our hand.
Let’s look at some charts.

Dow Jones $INDU pulled back to the early November high and bounced from that area of support. Now we are pressing up against the 31,250 level again. PPO indicator suggest the possibility for a bullish crossover. Either we break out of the channel or we continue to consolidate here for a little longer. My target remains 32,000 as long as we hold 30,000.

The S&P 500 is still holding within a bull channel. It broke down once but was saved quickly at the 50 SMA. That is when I started posting more long setups. Now we are reaching the top of the channel again. Perhaps we take a breathe here soon.
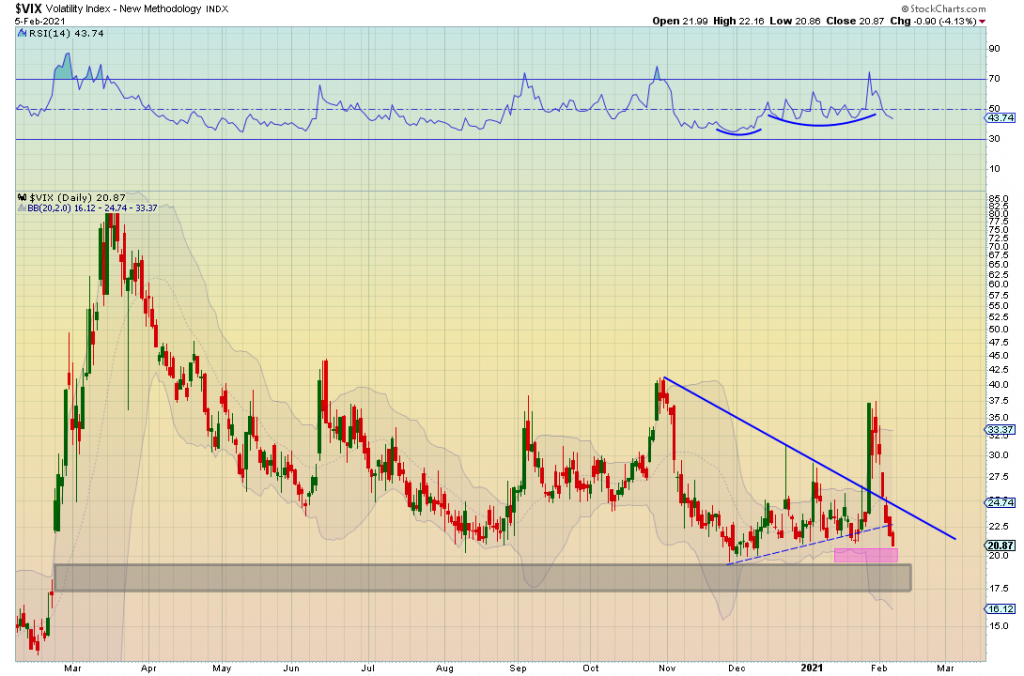
The VIX completely got crushed in the last week of trading. We reached up to 37.5. That was when I posted this tweet.
Now we broke down from the trendline again and are poised to reach into the pink box and even potentially the gap from February. With that said, stocks still have the potential to run higher. But that doesn’t mean you can throw caution into the wind.

The QQQ’s still are in a bull channel as well. Very bullish context can be seen just by looking at the moving averages on the chart. This is not something you would want to go short on. You can get lucky. But luck would be the only thing paying you out on a trade like that at this moment.

The CPC Put/Call Ratio “Sell Signal” is flirting with the red line still. Haven’t crossed above it yet, but when we do, that represents the “sell signal”.

Starting to see a little more breathe come into play here which is refreshing. However, still holding a negative divergence. Very similar to what we saw in february.

Same goes for the NAHL.

The Dollars recent move has not even bothered the markets. I think this is simply because we have not successfully got back above the 92 handle. Perhaps the market will take notice if we can get back above that handle.
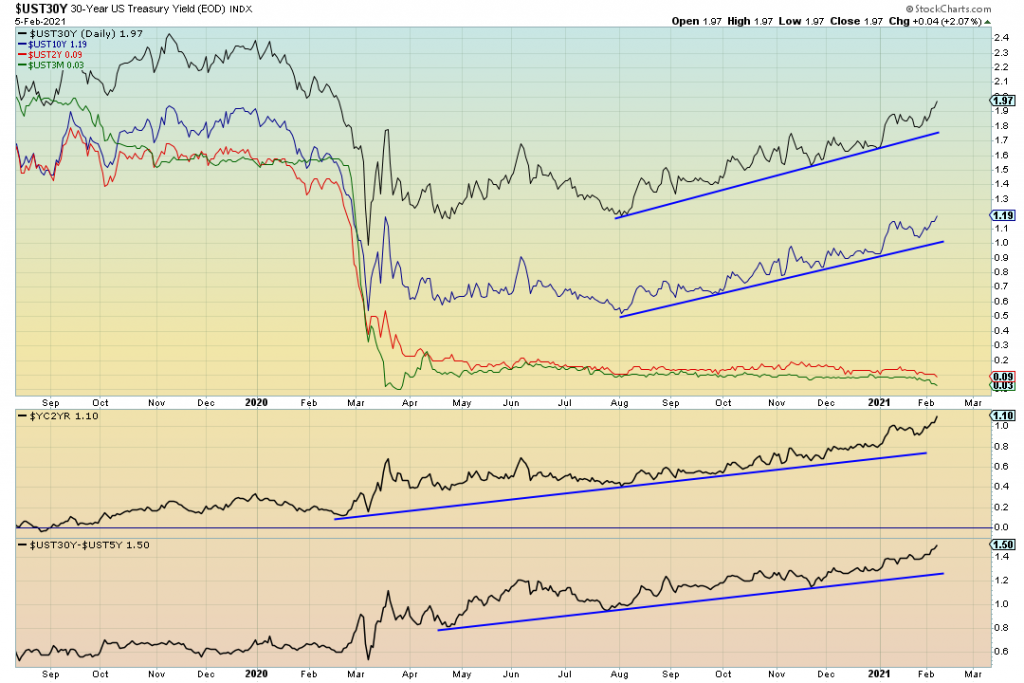
Yields continue trucking higher. you can see clearly they have been putting in higher lows since August. The 30yr-5yr spread just reached 1.5. The last time it reached that level was October 2015 (When fed started to raise rates).
I don’t belive they will be raising rates anytime soon given the current debt loads and insane monetary policy. Also, they did say they would keep rates here for multiple years even before thinking about thinking about raising rates. So what’s that mean for the markets if the 10yr and 30yr continue to rise?
Well rates are still relatively low, but if prices for high ticket items continue rising (homes, autos, etc) it’s going to make it harder to afford for the average consumer. Perhaps the fed will reinstate some form of yield curve control (If you don’t consider what they are doing now with asset purchase yield curve control).
Rising dollar, steepening curves, targeting higher inflation, commodities such WTIC & CRB have been on a complete rip higher…I don’t know, this seems to me like the best time to just be very very careful in the markets. Manage your risk, don’t let your guard down. If you do, there is going to be nothing to shield you from what might happen next.
See you back tonight on the Daily Stock Market Brief

